
Figure 2.
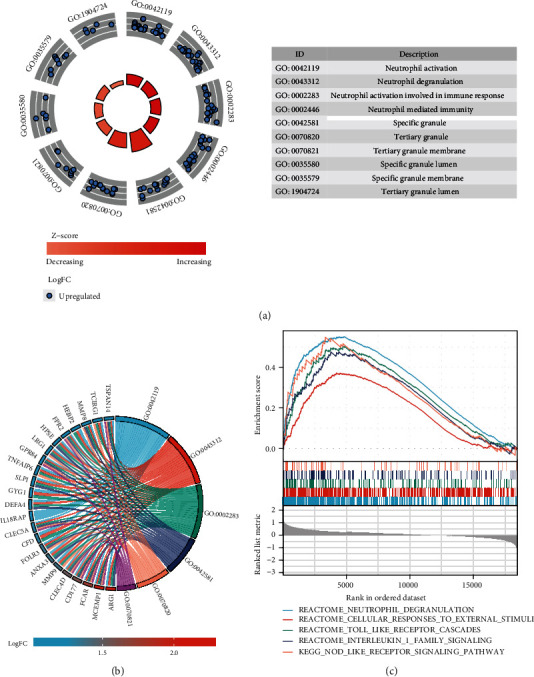
Functional enrichment analysis of DEGs. (a) GOCircle plot showing the top 10 of significantly changed functional terms of DEGs. The height of bars in the inner ring represented the -log 10 adjust P values of GO terms, with higher bars indicating higher significance of the GO category, and color corresponded to the z-score. The scatter plots in the out ring showed the expression levels of each gene (log fold change) in the corresponding GO terms. The description of GO categories was displayed in the table at the bottom. (b) GO chord plot showed genes linked by ribbons to their corresponding GO terms. Different colors represented different GO terms. (c) Results of gene set enrichment analysis in the cardioembolic stroke group.