
Figure 3.
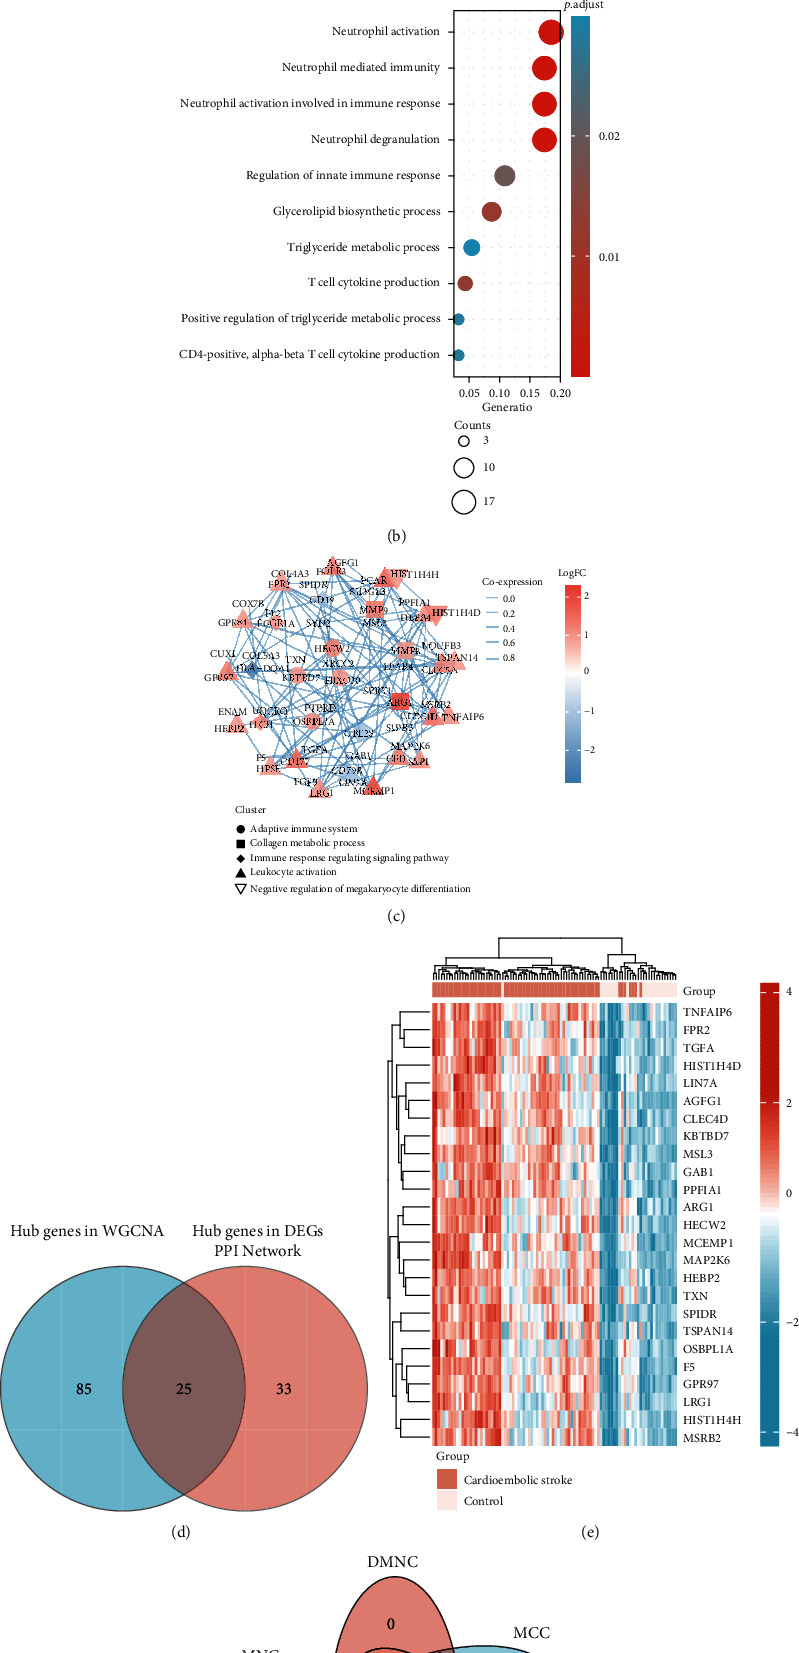
Identification of the key genes. (a) Heatmap of 110 hub genes in blue module. (b) GO analysis of 110 hub genes in blue module. (c) PPI network of 58 DEGs. The red color represented the upregulated genes while the blue color represented downregulated genes. DEGs were subsequently divided into different clusters based on their biological functions. The width of intergenic lines indicated the score of coexpression. (d) Venn plot of hub genes in WGCNA and DEGs. A total of 25 genes were identified as key genes. (e) Heatmap showing the expression profile of 25 key genes. (f) A Venn diagram between five algorithms of CytoHubba. CLEC4D, MCEMP1, GPR97, FPR2, and TSPAN14 were determined as the crucial genes in the cardioembolic stroke.