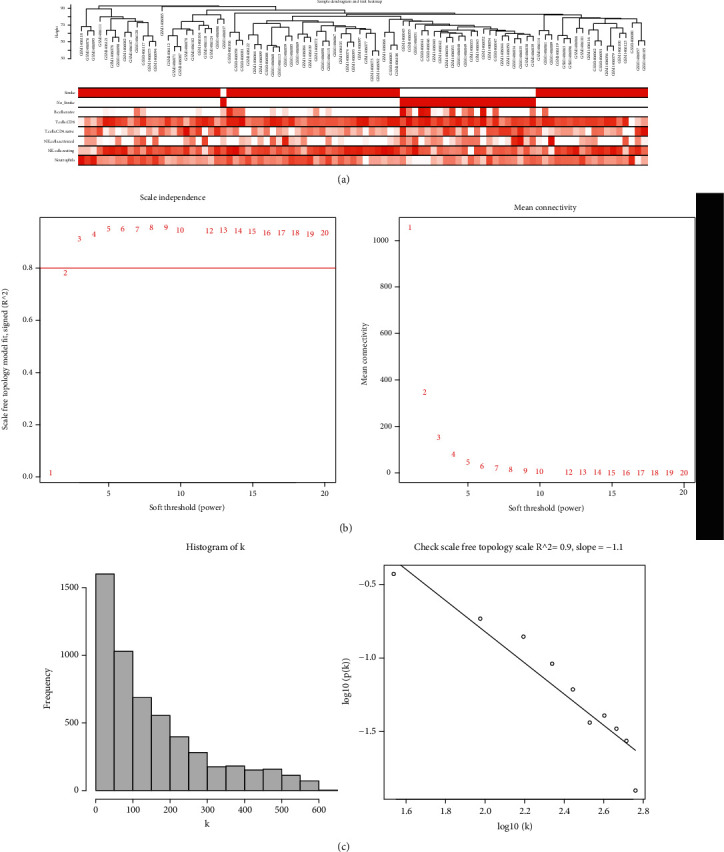
Figure 6.

Clustering of samples and selection of the best fit soft-thresholding power. (a) Clustering according to the expression level of cardioembolic stroke patients. The color intensity was proportional to disease status (stroke, no stroke) and infiltration-related immune cells. (b) The cut-off for soft-thresholding power β was set to be 0.80, and β =3 was determined. (c) The coexpression network exhibits a scale-free topology.
