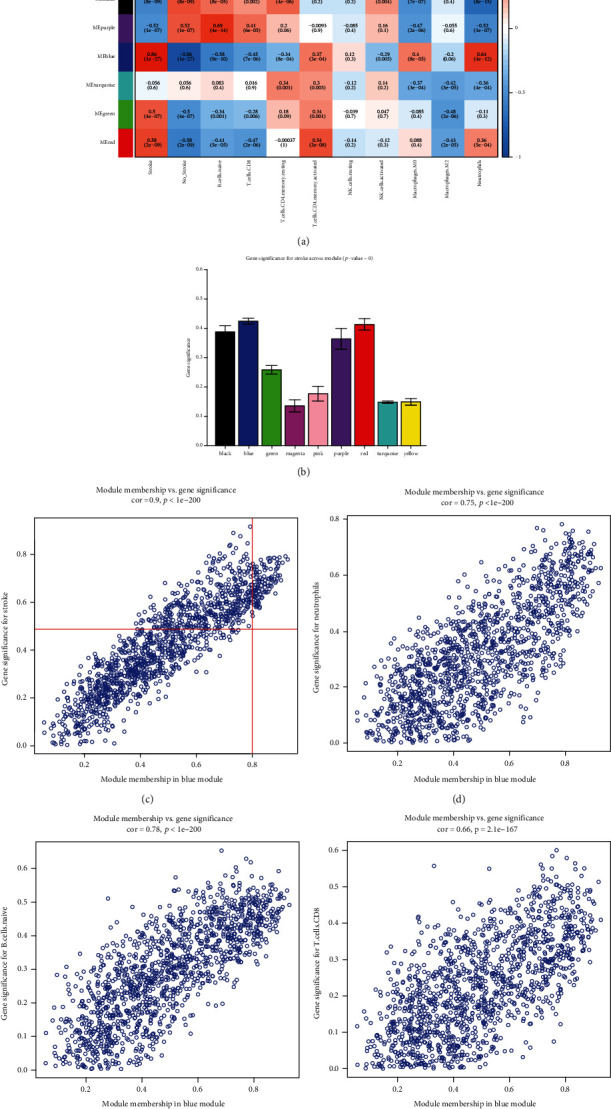
Figure 8.

Screening of clinical related modules. (a) Heatmap of module-trait correlation. Red represented positive correlation and blue represented negative correlation. (b) Gene significance for stroke across all modules, the blue module was determined as clinical related module. (c–f) Scatter plot for correlation between the module membership (MM) and gene significance (GS) revised MM and GS (c) stroke, (d) neutrophils, (e) B cells naïve, and (f) T cells CD8.
