Figure 1.

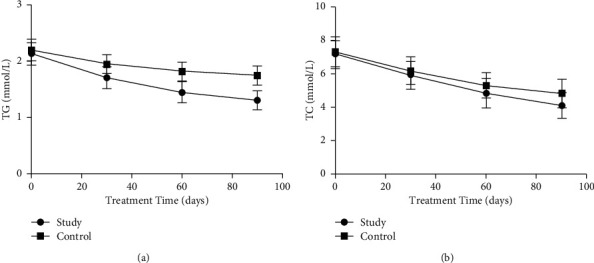
Comparison of blood lipid levels between the two groups before and after treatment. The comparison of (a) TG levels and (b) TC levels between the two groups at 30, 60, and 90 days before treatment.

Comparison of blood lipid levels between the two groups before and after treatment. The comparison of (a) TG levels and (b) TC levels between the two groups at 30, 60, and 90 days before treatment.