Figure 4.

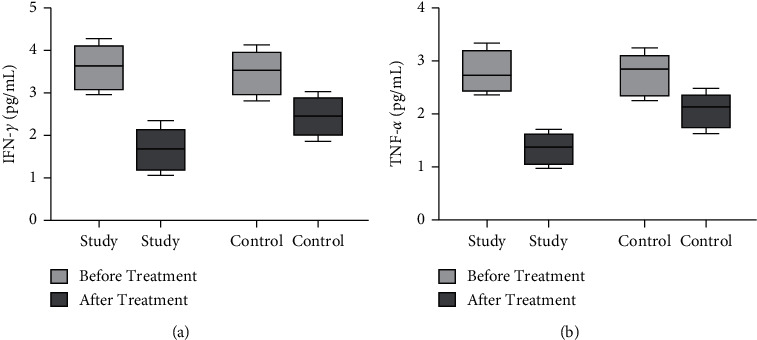
Comparison of serum cytokines levels between the two groups before and after treatment. The comparison of (a) serum IFN-γ levels and (b) serum TNF-α levels between the two groups before and after treatment.

Comparison of serum cytokines levels between the two groups before and after treatment. The comparison of (a) serum IFN-γ levels and (b) serum TNF-α levels between the two groups before and after treatment.