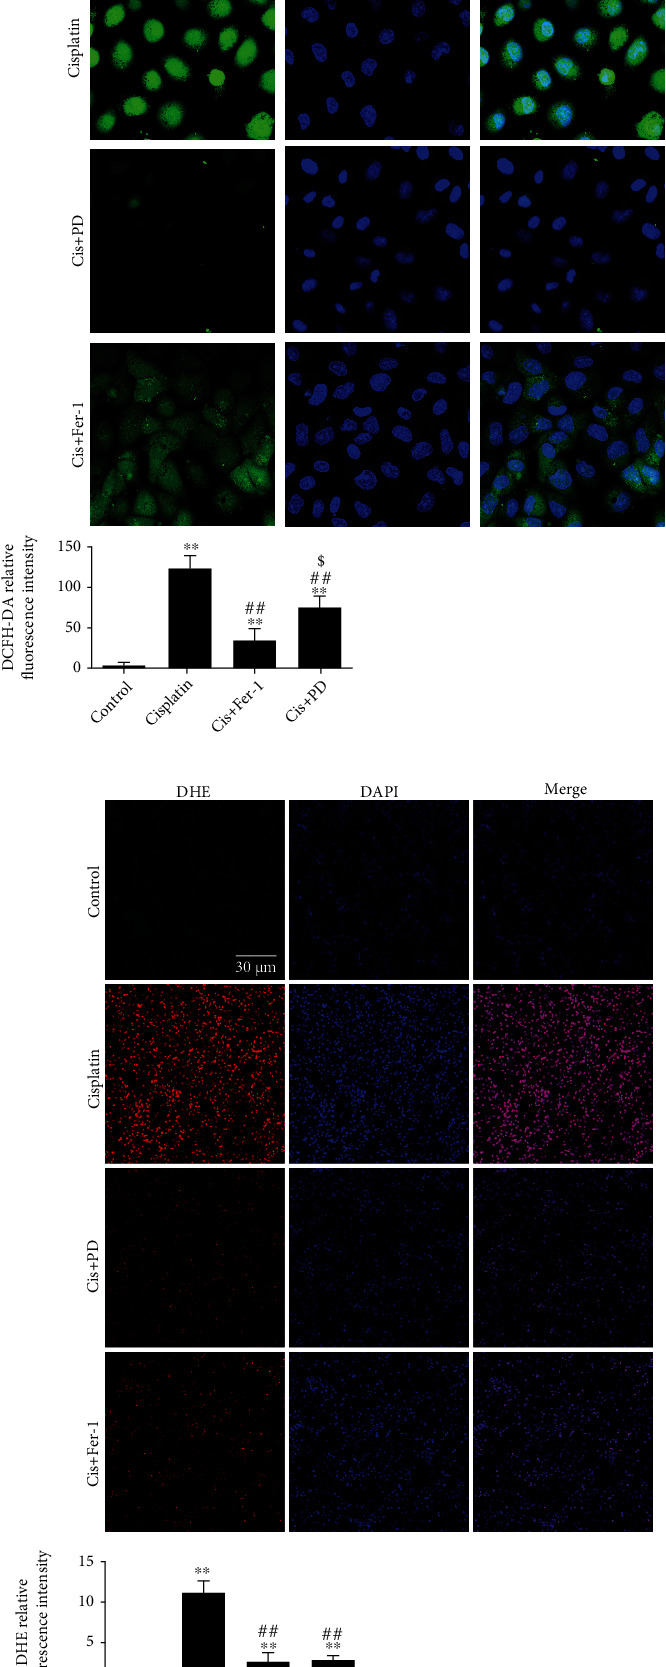
Figure 4.

PD limits intracellular ROS increase induced by cisplatin in vitro and in vivo. (a) The ROS level of HK-2 cells was captured by CLSM at 24 h after cisplatin injection (DCFH-DA fluorescent staining, 600x magnification). (b) The ROS level of kidney tissues was captured by CLSM at 48 h after cisplatin injection (DHE fluorescent staining, 200x magnification). ∗P < 0.05, ∗∗P < 0.01 vs. control; #P < 0.05, ##P < 0.01 vs. cisplatin; $P < 0.05, $$P < 0.01 vs. Cis+PD (n = 5–7). Cis: cisplatin; PD: polydatin; Fer-1: ferrostatin-1; DCFH-DA: 2′,7′-dichlorofluorescin diacetate; DHE: dihydroethidium.
