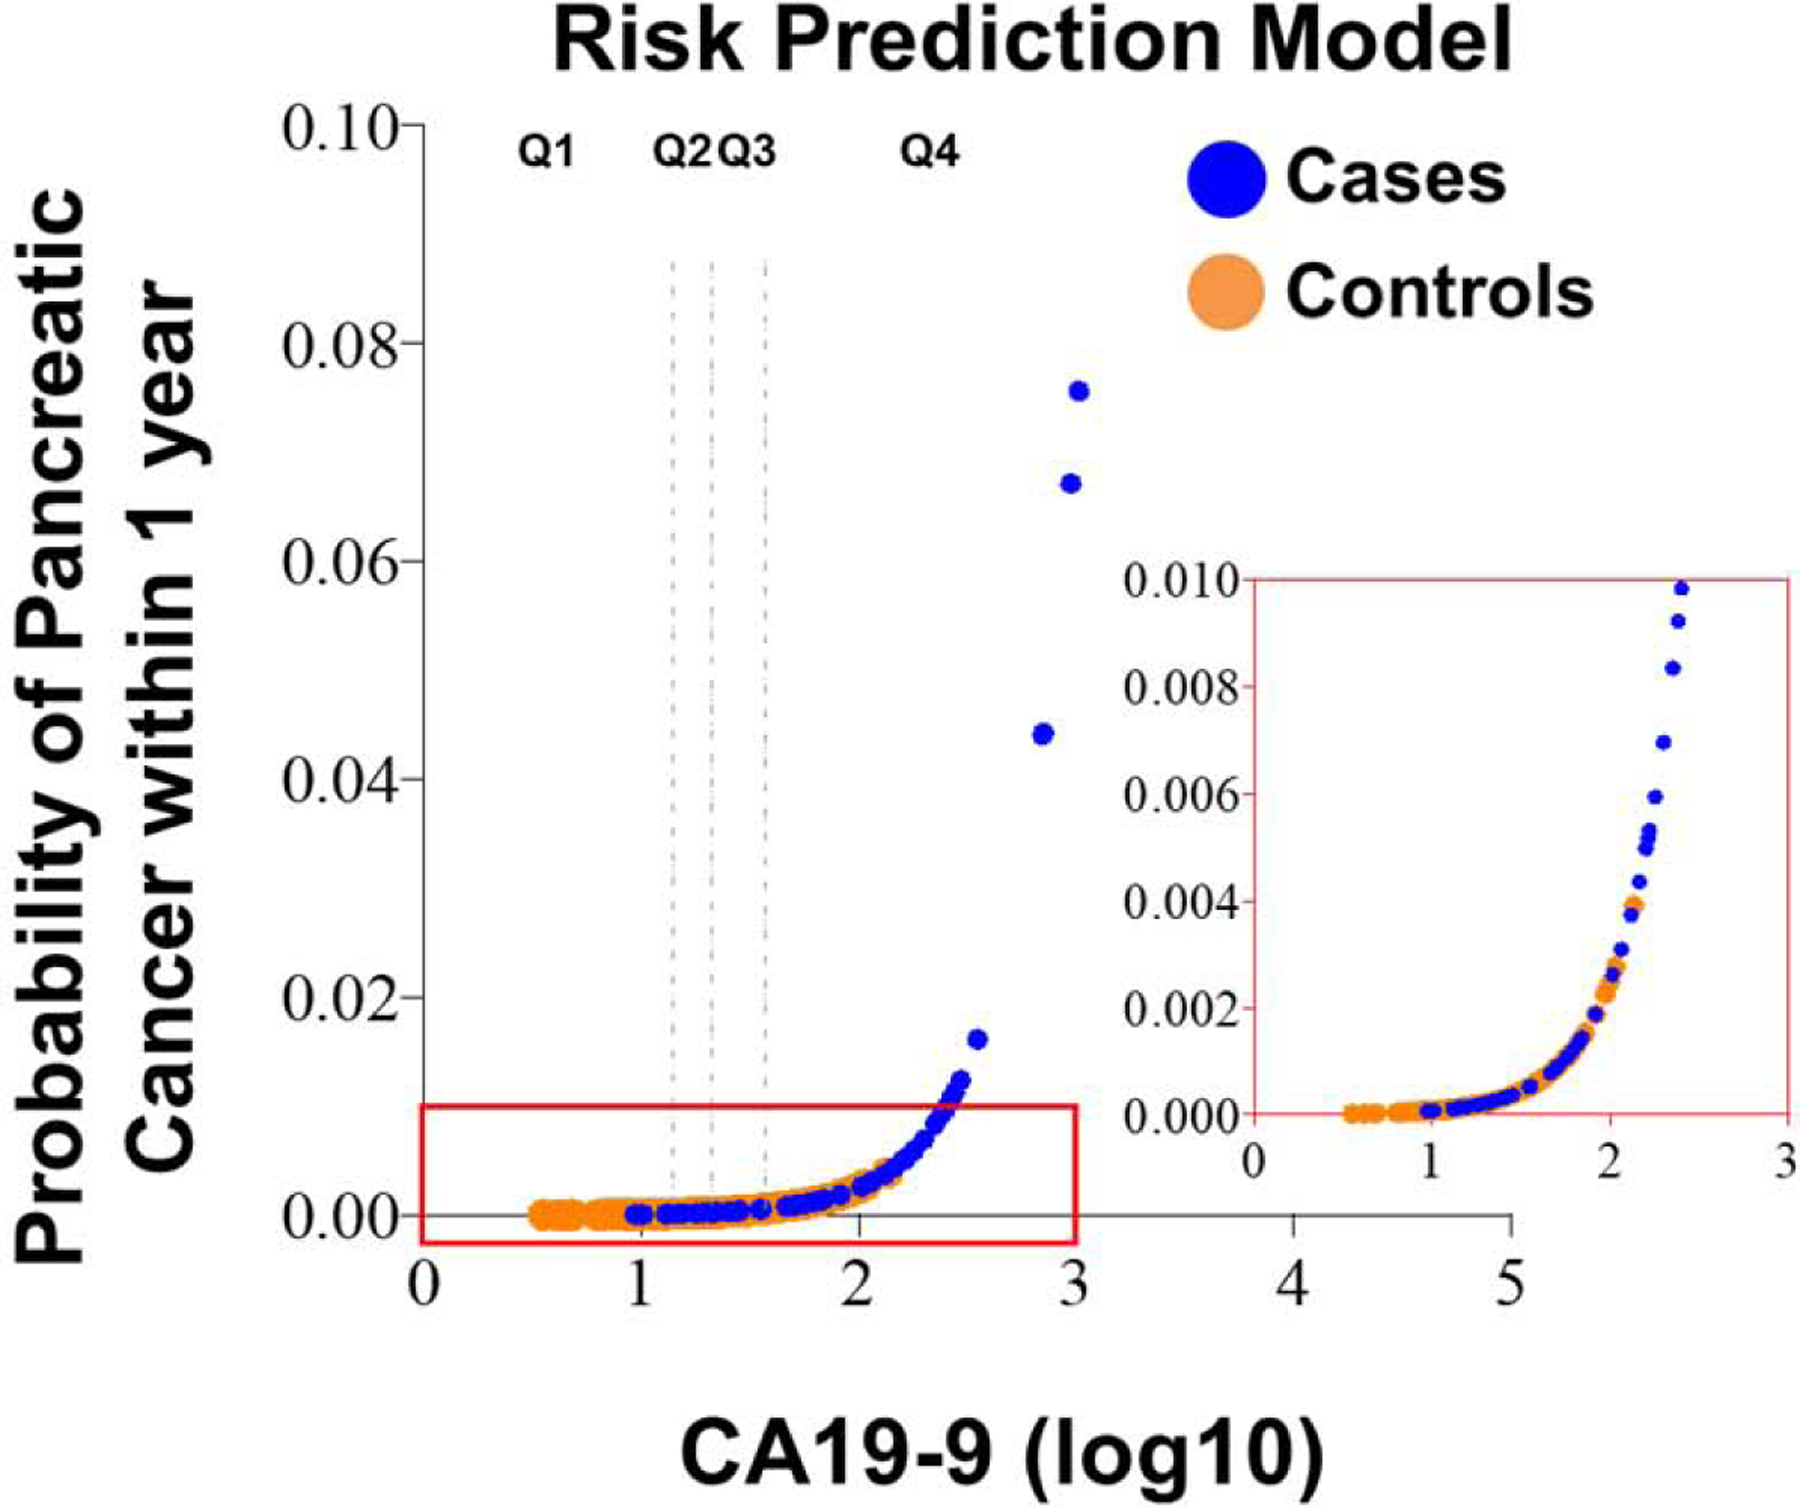
Figure 2. Predicted probability of pancreatic cancer within 1 year according to CA19-9 values.

The rug plot shows the observed distribution of biomarker scores. The vertical broken lines correspond to the quartiles threshold for CA19-9 values amongst controls (Q1, Q2, Q3, and Q4).
