
Figure 5. Classifier performance of a 3-marker panel consisting of LRG1, TIMP1 and CA19-9 for identifying cases diagnosed within 1 year and that were ‘negative’ for CA19-9 alone based on a 99% specificity cutoff.
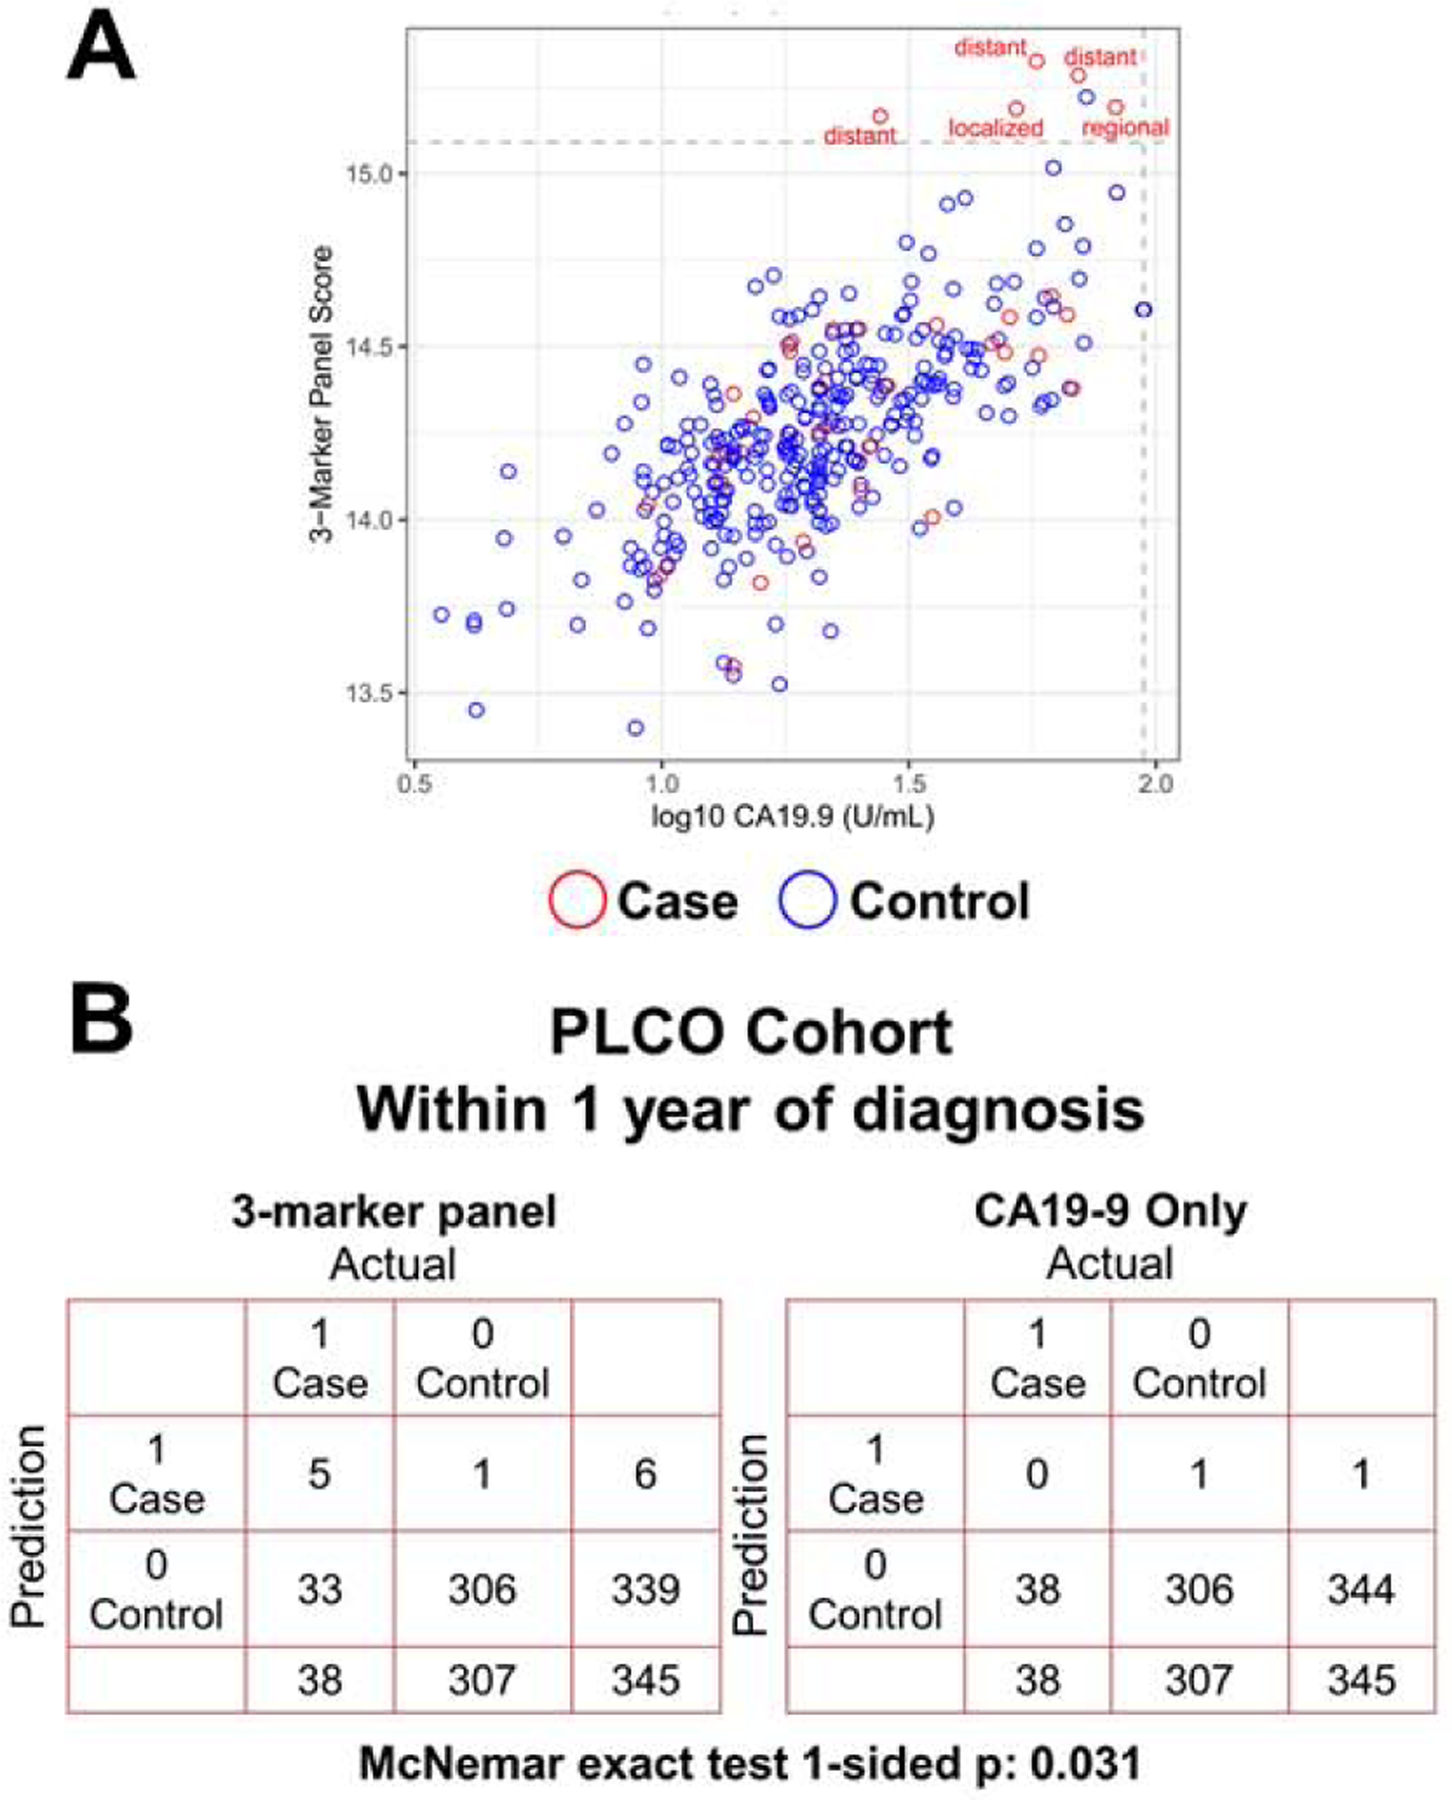
A) Scatter plot illustrating the distribution of the 3-marker panel scores (Y-axis) and log10 CA19-9 values (X-axis). Broken lines represent >99% specificity cutoffs. The 3-marker panel was derived using fixed beta-coefficients from the logistic regression model previously developed elsewhere18. B) Confusion matrix describing the performance of the classification model corresponding to the 3-marker panel and CA19-9 alone at >99% specificity. Statistical significance was determined by 1-sided McNemar exact test.