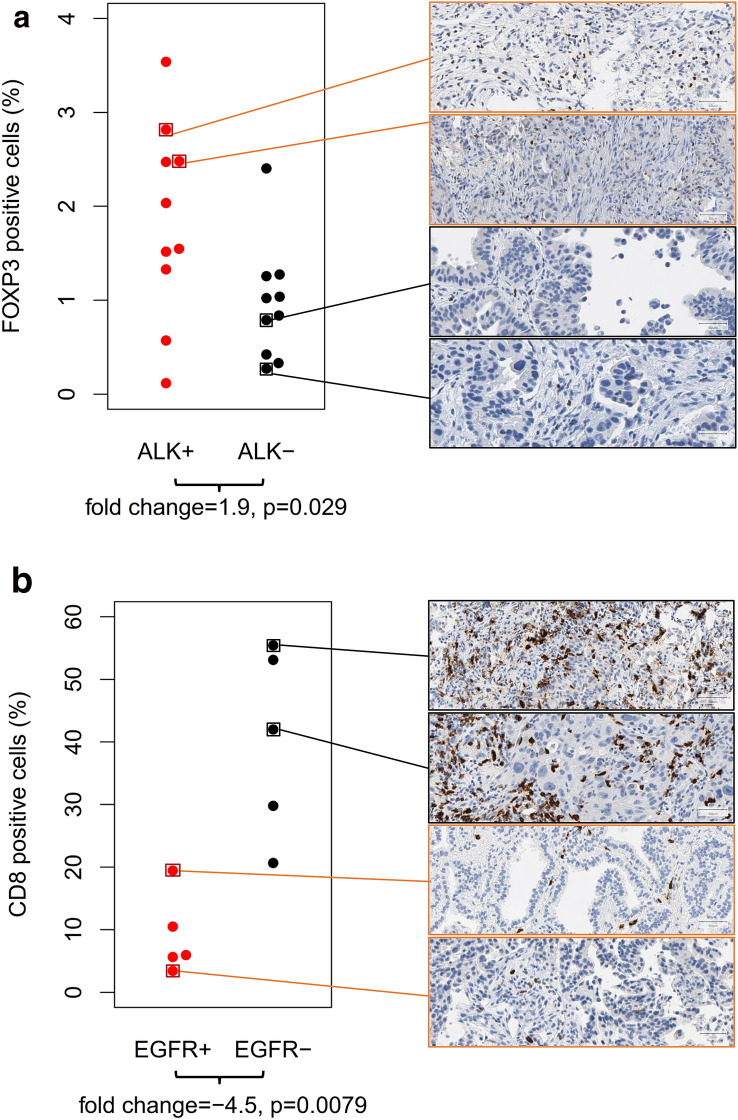
Fig. 3.
Immunohistochemical analysis of FOXP3 and CD8 protein expression in representative example cases of the study cohort. Positive cells were quantified as percentage of all (tumor and stroma) cells. a Comparison of ALK-positive tumors with high Treg mRNA marker and ALK-negative tumors with low Treg mRNA marker. The percentage of FOXP3-positive cells was significantly higher in the ALK-positive tumors (mean: 1.84%) than in ALK-negative tumors (mean: 0.96%). b Comparison of EGFR-positive tumors with low cytotoxic cell mRNA marker and EGFR-negative tumors with high cytotoxic cell mRNA marker. The percentage of CD8-positive cells was significantly lower in the EGFR-positive tumors (mean: 9%) compared to the EGFR-negative tumors (mean: 40%)

