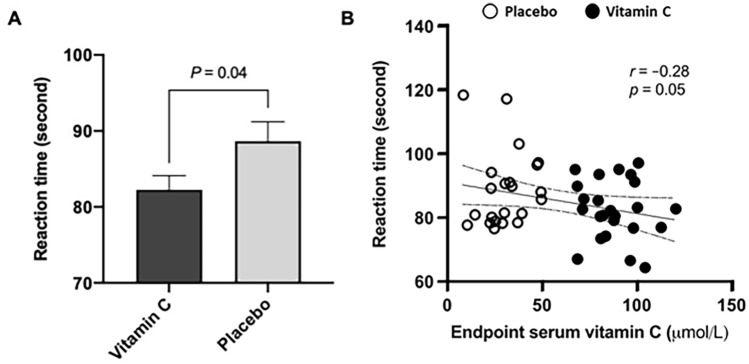
Fig. 3.
Performance difference in the Stroop color–word test between the vitamin C group (n = 24) and the placebo group (n = 22). Reaction time was calculated as the sum of the time taken to report the correct answers out of the 128 items. A There was a significant difference in the reaction time between the vitamin C and the placebo groups (p = 0.04; unpaired t test). B There was a clear tendency to significance in a correlation between the endpoint serum concentration of vitamin C and the reaction time (r = − 0.28, p = 0.05; Pearson’s correlation analysis). The correlation plot is shown with a regression line and 95% confidence interval

