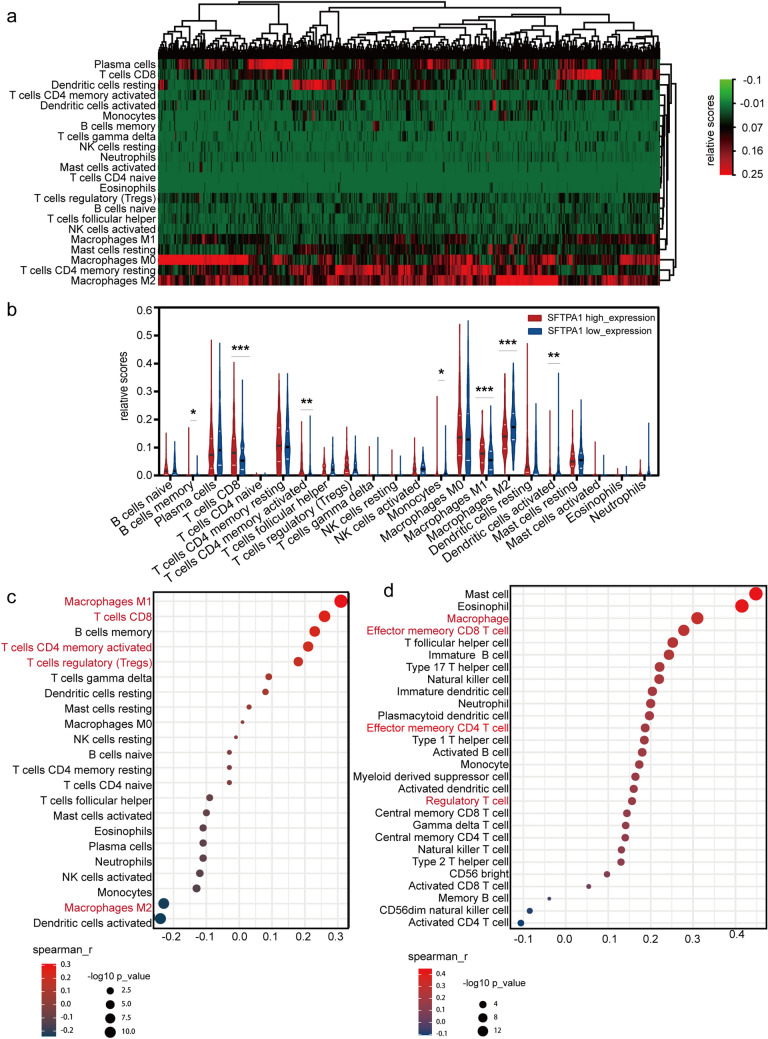
Fig. 6.
Immune cell infiltration landscape in SFTPA1-high/low expression groups in LUAD a Heatmap of 22 immune cell subpopulations based on deconvolution by CIBERSORT in LUAD. b There were 22 immune cell subpopulations in the SFTPA1-high expression group compared with the SFTPA1-low expression group in LUAD. (t-test, P-value Significant Codes: 0 ≤ *** < 0.001 ≤ ** < 0.01 ≤ * < 0.05). c & d Spearman correlation between the level of SFTPA1 expression and immune cell subpopulations by CIBERSORT (c) and TISIDB (d)

