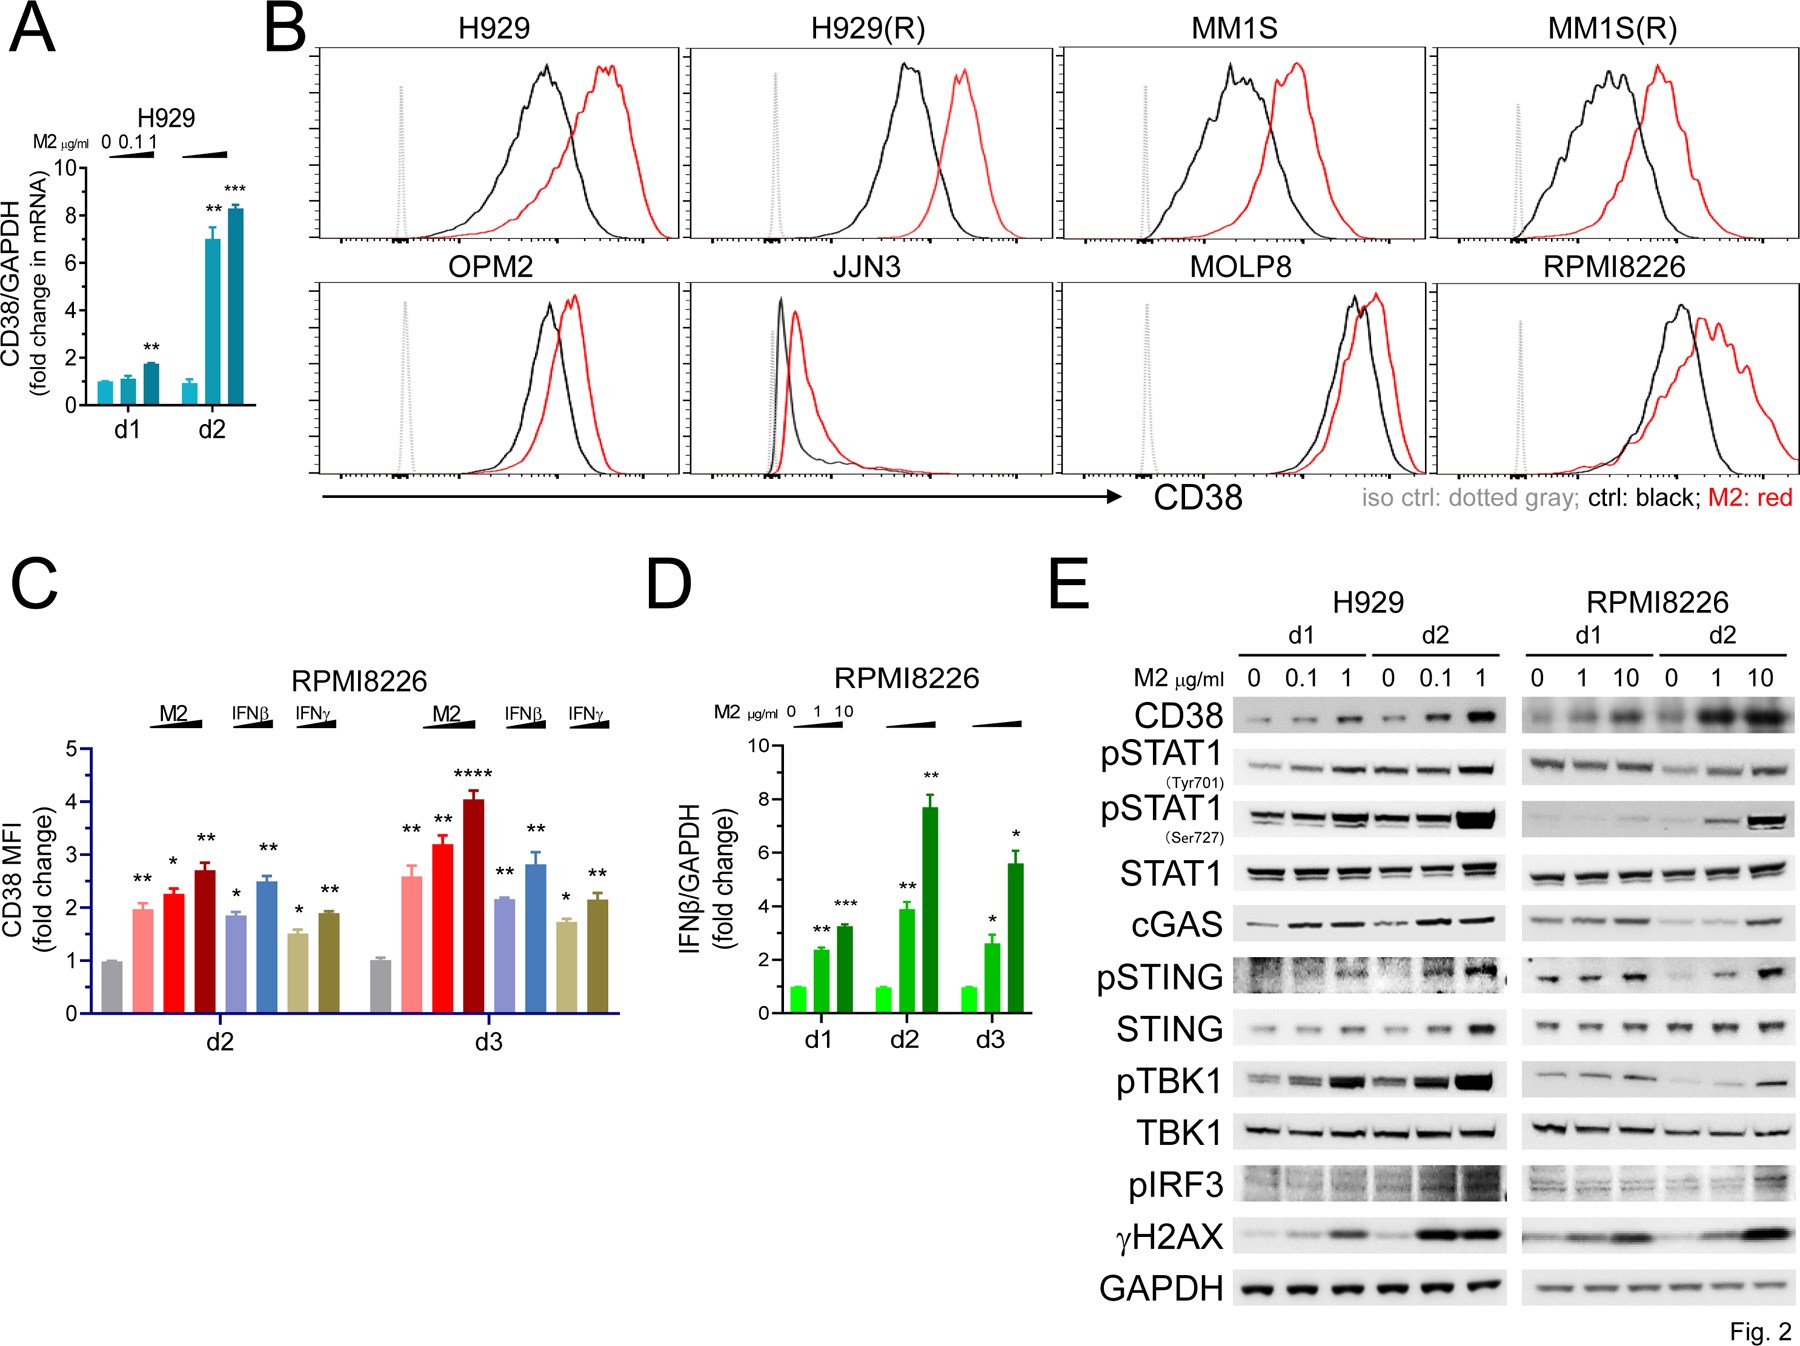
Figure 2. CD38 is upregulated by M2-induced DNA damage response associated with activation of STAT1 and cGAS-STING signaling in MM cells.

A Using real-time qRT-PCR, CD38 transcript levels were quantitated in M2-treated H929 cells at day 1 (d1) and d2. B-C Using flow cytometry (FC) analysis, CD38 membrane expression was determined on viable (Aqua-/Annexin V-) MM cells. B, Eight MM cell lines were treated with M2 for 3 days, including 4 sensitive (0.1 μg/ml, upper panel) and 4 less sensitive (1 μg/ml, lower panel) to M2. Shown are histograms (B) and fold increases in geometric mean fluorescence intensity (MFI) values of CD38 at indicated treatments vs ctrl vehicle groups (C). C RPMI8226 cells were treated with M2 (1, 5, 10 μg/ml), IFNβ or IFNγ (100, 500 U units/ml) at d2 and d3. D IFNβ expression levels were quantitated by real-time qRT-PCR analysis following M2 treatment for various time intervals. E Protein lysates were made from H929 (left) and RPMI8226 (right) cells followed by immunoblotting using antibodies specific for indicated molecules to examine activation of STAT1 and cGAS-STING signaling cascades. GAPDH served as a loading control. Each experiment was performed at least thrice in triplicate for each condition, and data are presented as means ± SDs (error bars). *P < .05, **P < .01, ***P < .001, ****P < .0001
