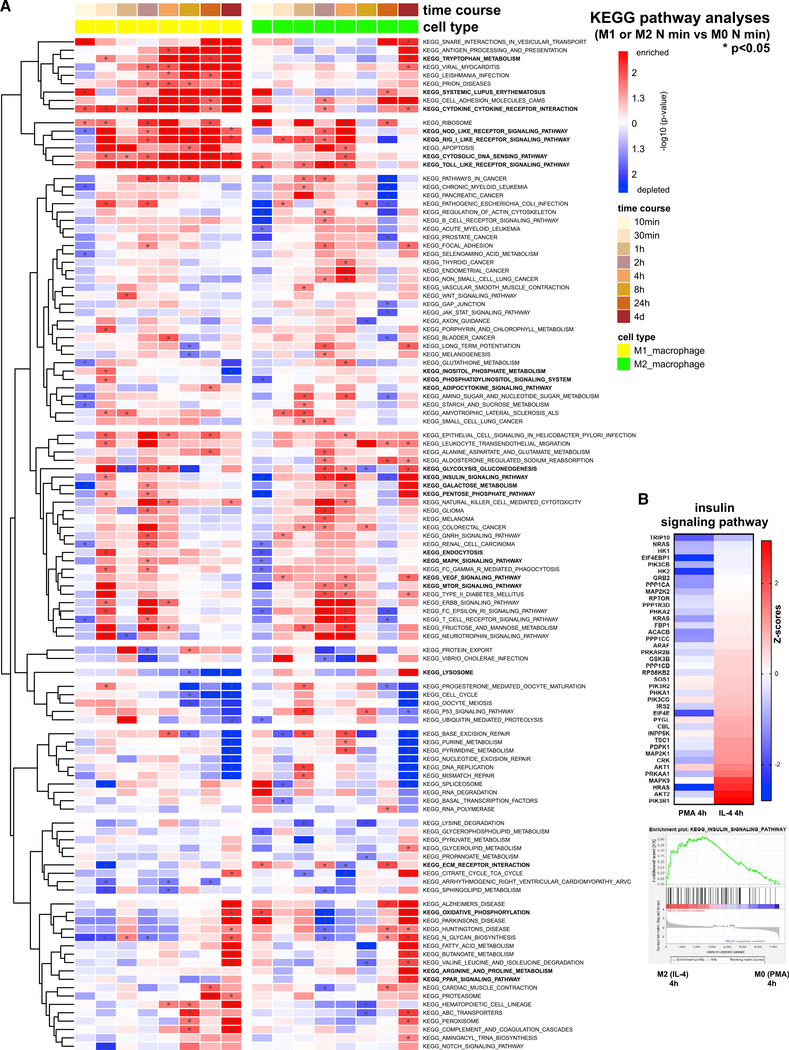
Figure 1. Time-course global quantitative proteomics identify dynamic temporal changes in cellular and metabolic pathways during M1- versus M2-type macrophage polarization.
(A) Heatmap shows KEGG pathways upregulated in at least one time point, based on the time-course proteomics data of macrophages undergoing M1- (treated with IFN-γ/LPS) or M2-type polarization (treated with IL-4). Color coding indicates −log10 p values when comparing the M1 or M2 group at the indicated time point with the M0 group (after 24 h PMA treatment only) at the same corresponding time point. *p < 0.05. Select pathways with distinct activation pattern during M1- versus M2-type polarization are indicated in bold.
(B) Insulin signaling pathway protein changes and KEGG enrichment plot shown in macrophages after 4 h of treatment with IL-4 (compared with M0 macrophages). Heatmap shows Z scores.
See also Figures S1–S4; Tables S1 and S2.

