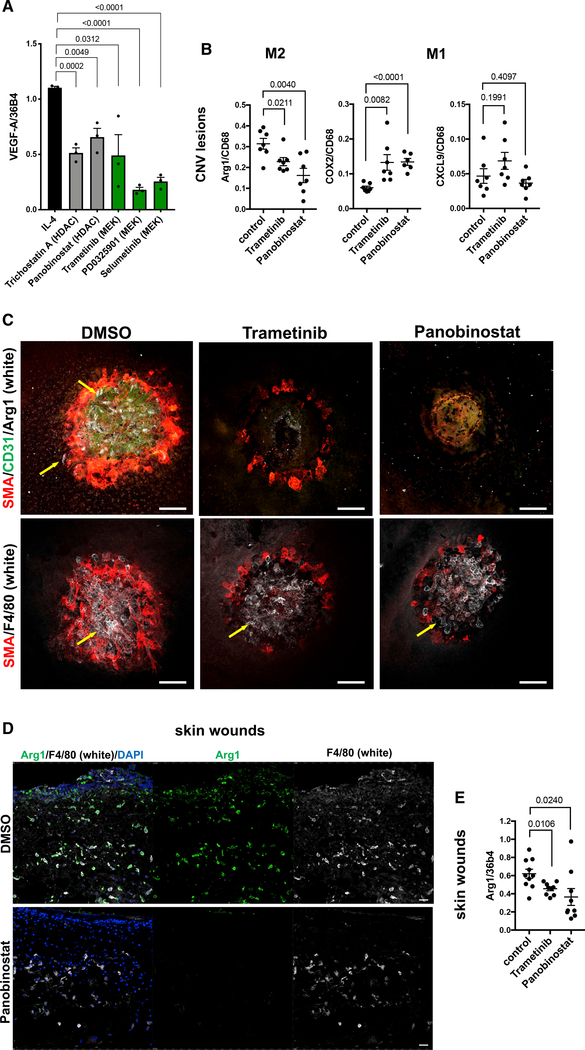
Figure 7. Panobinostat and trametinib block M2-type macrophage polarization in vivo and inhibit CNV.
(A) MEK inhibitors and HDAC inhibitors attenuate VEGF-A expression in IL-4-treated THP-1-derived macrophages. Normalized to housekeeping gene 36B4 (semiquantitative RT-PCR). Cytokine treatment for 4 days. N = 3/group (each in triplicate).
(B) Semiquantitative RT-PCR of choroid/RPE lysates of mice treated with either panobinostat, trametinib, or DMSO (control) for 3 days after laser-induced CNV induction. Graphs show Arg1 (M2), COX2 (M1), and CXCL9 (M1) expression normalized to CD68. N = 8–10 mice/group (each in triplicate).
(C) Confocal microscopy images of CNV lesions 3 days after laser-induced injury and treatment with either DMSO, trametinib, or panobinostat. Arg1+ macrophages (white; yellow arrows), SMA+ cells (red), and CD31+ neovessels (green) in DMSO-treated mice, but no Arg1 or CD31 and only reduced SMA staining is observed in trametinib or panobinostat treated mice (top row). Panobinostat or trametinib treatment does not prevent macrophage infiltration (F4/80+ cells [white]; bottom row). Scale bars, 100 μm.
(D) In skin wounds infiltrating F4/80+ (white) macrophages are strongly Arg1+ (green). Panobinostat-treated mice show infiltration of F4/80+ macrophages, which do not stain for Arg1. Scale bars, 20 μm.
(E) Semiquantitative RT-PCR shows inhibition of Arg1 expression in skin wounds after trametinib or panobinostat treatment (normalized to 36b4). N = 8–10 mice/group (each in triplicate).
Graphs represent data as means ± SEM. p values are shown (t test). See also Table S3.

