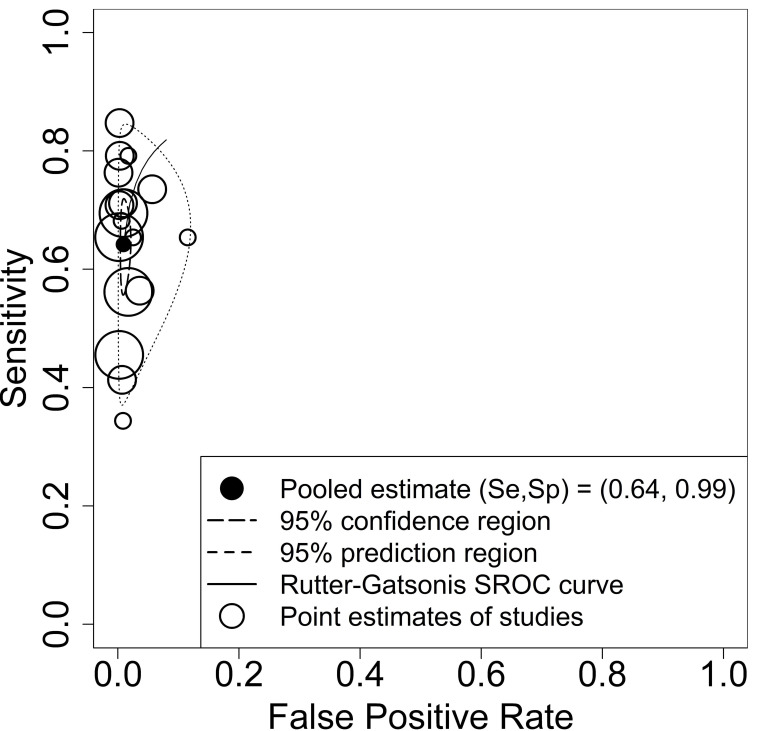
Figure 5.
Summary receiver operating characteristic (SROC) plot of sensitivity and specificity of antigen tests for diagnosis of current SARS-CoV-2 infections in entire paediatric study populations irrespective of symptoms. Each circle represents the point estimate of an individual study, whereas the size of the circle correlates with the number of paediatric study participants (small circle: 500 participants). The pooled estimate (black dot) of the pair of sensitivity (Se) and specificity (Sp) is surrounded by its 95% confidence region (closed curve with short dashes) and prediction region (closed curve with long dashes). The estimation of the SROC curve is based on the bivariate approach by Rutter and Gatsonis.77

