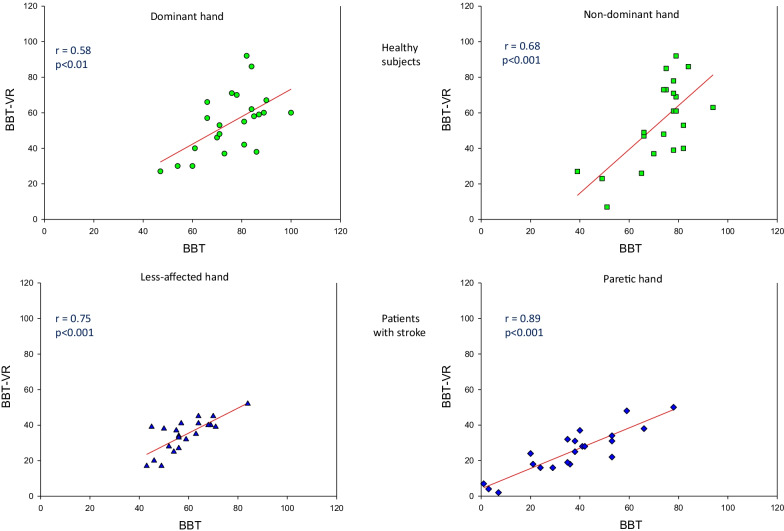
Fig. 3.
Correlation between the classical BBT score and BBT-VR score. Each point represents the score obtained by each participant’s hand during the third trial of the BBT-VR in relation to the score obtained during the third trial of the BBT. Pearson correlation coefficients (r) and their p-value (p) are presented at the left side of each graph. Linear regressions are plotted for each graph (in red). Scores of healthy participants are presented in green (dominant hand = circle; non-dominant hand = square) and scores of patients with stroke in blue (less-affected hand = triangle; paretic hand = diamond)

