Fig. 1.
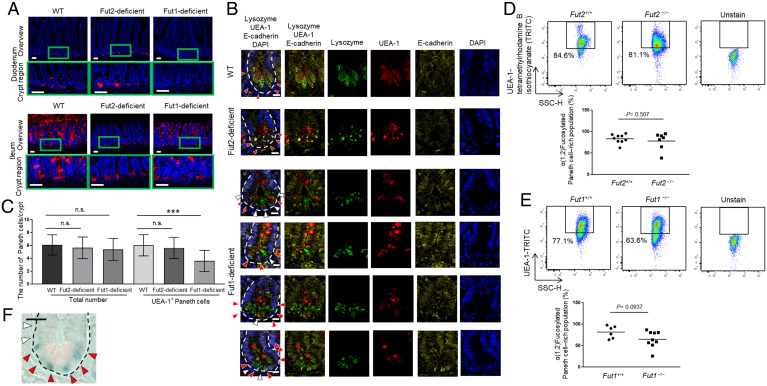
Paneth cells are divided into two subtypes: Fut2+ and Fut2− Paneth cells. (A) Sections of ileum and duodenum of WT, Fut2-deficient, and Fut1-deficient mice were stained with UEA-1 (red) and DAPI (counterstain; blue). Crypt regions are indicated with green boxes. (Scale bars, 50 µm.) Data are representative of three independent experiments. (B) Sections of ileum of WT, Fut2-deficient, and Fut1-deficient mice were stained with UEA-1 (red), anti-lysozyme antibody (green), DAPI (counterstain; blue), and anti–E-cadherin antibody (plasma membrane; yellow). Red arrows, lysozyme+ UEA-1+ cells; white arrows, lysozyme+ UEA-1− cells; and white dotted lines delineate crypts. (Scale bars, 10 μm.) Data are representative of three independent experiments. (C) Numbers of lysozyme+ UEA-1+ cells and lysozyme+ UEA-1− cells per crypt were counted in 49 ileal crypts pooled from nine WT mice, 40 ileal crypts pooled from eight Fut2-deficient mice, and 23 ileal crypts pooled from three Fut1-deficient mice. Data are presented as mean ± SD. n.s., not significant, ***P < 0.001, Student’s t test. (D and E) Flow cytometric analysis of ileal crypt epithelial cells from Fut2-deficient (Fut2−/−) and WT (Fut2+/+) mice (D) and Fut1-deficient (Fut1−/−) and WT (Fut1+/+) mice (E). The UEA-1+ (fucosylated) Paneth cell–rich fraction is indicated by the black boxes. Mean percentage of the fucosylated, Paneth cell–rich population is shown. P values by Student’s t test are shown. (F) Fut2 promoter activity was examined by X-gal staining. Sections of ileum from Fut2LacZ/+ mice were stained with anti-lysozyme antibody (red), and Fut2 promoter activity (i.e., β-gal derived from the LacZ gene) was detected as a blue color. Red arrows, Paneth cells expressing Fut2 and white arrows, Paneth cells not expressing Fut2. The dotted lines delineate crypts. (Scale bar, 20 μm.) Data are representative of three independent experiments.

