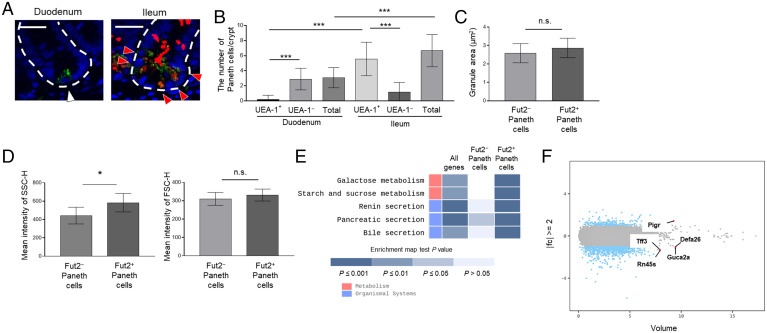
Fig. 2.
Characterization of Fut2+ and Fut2− Paneth cells. (A) Sections of duodenum and ileum from Fut1-deficient mice were stained with UEA-1 (red), anti-lysozyme antibody (green), and DAPI (counterstain; blue). Red arrows, lysozyme+ UEA-1+ cells; white arrow, lysozyme+ UEA-1− cell; and white dotted lines delineate crypts. (Scale bars, 20 μm.) Data are representative of three independent experiments. (B) The numbers of lysozyme+ UEA-1+ cells and lysozyme+ UEA-1− cells per crypt were counted in 48 duodenal and 39 ileal crypts pooled from four Fut1-deficient mice. Data are presented as mean ± SD ***P < 0.001, Student’s t test. (C) The granule area in ileal Fut2+ and Fut2− Paneth cells was measured in 10 crypts per mouse with the ImageJ software. Data are presented as mean ± SD (n = 8 Fut2LacZ/+ mice per group). n.s., not significant, Student’s t test. (D) SSC-H and FSC-H profiles of ileal Fut2+ and Fut2− Paneth cells detected by using the fluorescent probe Zinpyr-1 and UEA-1 (see SI Appendix, Fig. S1 for the gating strategy). Data are presented as mean ± SD (n = 6 Fut1LacZ/LacZ mice per group). *P < 0.05, n.s., not significant, Student’s t test. (E) Enrichment pathway heatmap obtained from a KEGG analysis. The heatmap shows, from left to right, genes with at least twofold different (|fc| ≥ 2) expression between Fut2+ and Fut2− Paneth cells; genes that are highly expressed in Fut2−, but not Fut2+, Paneth cells; and genes that are highly expressed in Fut2+, but not Fut2−, Paneth cells. P values were obtained using the modified Fisher’s exact test. Blue colored boxes mean P values. Empty boxes mean that there is not matched gene. (F) Volume plot analysis of the genes examined in the transcriptomics analysis. Blue dots indicate the genes with at least twofold different (|fc| ≥ 2) expression between Fut2+ and Fut2− Paneth cells. Red dots indicate the five genes with the highest expression volumes among those with |fc| ≥ 2.

