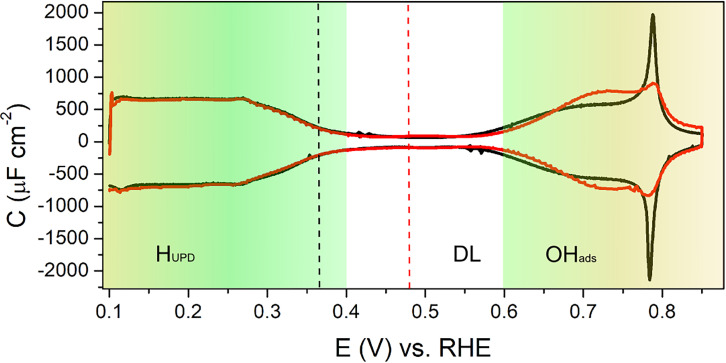
Fig. 1.
Capacitance curves generated from cyclic voltammograms of Pt(111) in 0.1 M HClO4 (pH = 1, scan rate = 50 mV/s, black line) and 1mM HClO4 (pH = 3, scan rate = 10 mV/s, red line) showing HUPD, double layer (DL), and OHads regions; the black and red dashed lines correspond to the expected potential of zero charge at pH 1 and 3, respectively.

