Fig. 1.
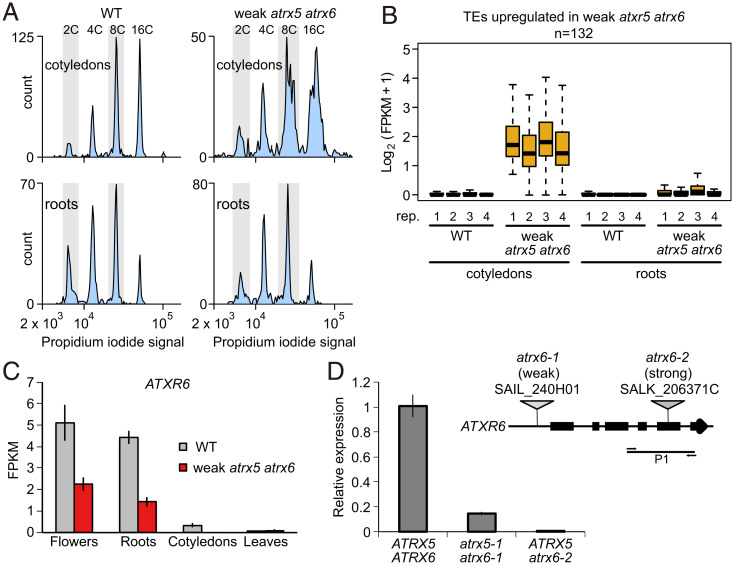
Tissue-specific defects in atxr5/6 mutants. (A) Flow cytometry profiles of nuclei from wild-type (WT) and atxr5/6 (W) mutant cotyledons and root tissue. (B) Boxplot of log2(FPKM + 1) expression values for TEs up-regulated in atxr5/6 cotyledons, in four replicates each of wild-type and atxr5/6 cotyledons and roots. Center lines indicate the median, upper and lower bounds represent the 75th and 25th percentiles, respectively, whiskers indicate the minimum and the maximum, and outliers are not shown. (C) Bar chart of RNA-seq FPKM values for ATXR6 expression in wild-type plants and atxr5/6 (W) mutants in floral (n = 3), root (n = 4), cotyledon (n = 4), and leaf (n = 3) tissues. Bars represent average and whiskers represent ± SE (SEM) across the three or four biological replicates. (D, Top) Genomic structure of ATXR6 with T-DNA insertion sites indicated. Horizontal line represents the amplified region (P1) for qRT-PCR. (D, Bottom) qRT-PCR analysis of ATXR6 expression in 2-wk-old seedlings in wild-type, atxr5-1 atxr6-1 (W/W), and ATXR5 atxr6-2 (S/S) plants. Bar represents average and whiskers represent ± SE (SEM) from n = 3 biological replicates of the indicated samples.

