Fig. 3.
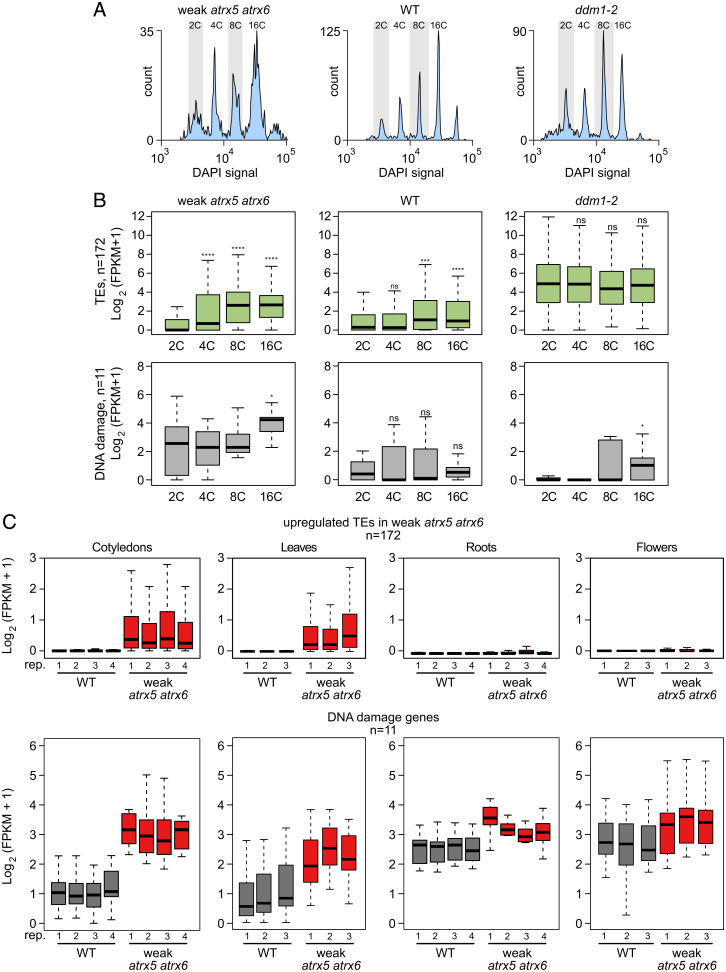
Characterization of ploidy- and tissue-specific transcriptional profiles in wild type, atxr5/6 (W), and ddm1-2 mutants. (A) Representative flow cytometry profiles of wild-type, atxr5/6 (W), and ddm1-2 cotyledons used to generate Smart-seq2 libraries. For Smart-seq2, each replicate consisted of a pool of 50 nuclei sorted from the indicated peak of the histogram (peaks labeled at top). (B) Boxplot of RNA-seq log2 expression (average FPKM + 1) of TEs (Top) and DNA damage genes (Bottom) detected in Smart-seq2 libraries as a function of ploidy in wild-type, atxr5/6 (W), and ddm1-2 cotyledons. Center lines indicate the median, upper and lower bounds represent the 75th and 25th percentiles, respectively, whiskers indicate the minimum and the maximum, and outliers are not plotted. Values plotted represent an average of two to four independent replicates. Unpaired two-sample Wilcoxon test was used to determine significance between 2C and 4C, 8C, and 16C nuclei for the indicated samples: ns, P value > 0.05; *P ≤ 0.05, **P ≤ 0.01, ***P ≤ 0.001, ****P ≤ 0.0001. (C) Boxplot of RNA-seq log2 expression (average FPKM + 1) of TEs (Top) and DNA damage genes (Bottom) in cotyledons, roots, leaves, and flowers in wild type and atxr5/6 (W) mutant (three or four replicates each).

