Fig. 1.
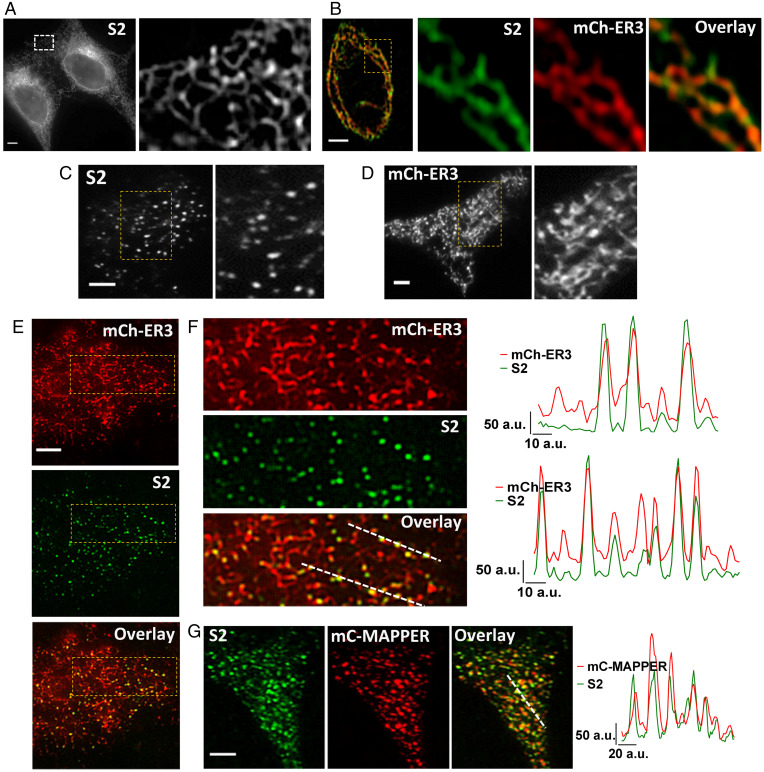
Visualization of endogenous STIM2. (A) Localization of endogenous mVenus-STIM2 (mV-STIM2; S2 in images, acquired by confocal microscopy) in STIM2-KI cells, enlargement of the demarcated area shown on the Right. (B) Airyscan images with enlarged region of STIM2-KI cell showing mV-STIM2 (green), expressed mCherry-ER3 (mCh-ER3, red), and overlay. (C) TIRFM images of STIM2-KI cells in basal, unstimulated conditions with enlargement of demarcated area on the Right. (D) Localization of mCh-ER3 in HEK293 with enlarged area on the Right. (E) Images from Upper to Lower: mCh-ER3 expressed in STIM2-KI cells (ER, red), mV-STIM2 (S2, green), and overlay. (F) Enlarged images of demarcated regions in E and line scans (position indicated in overlay image mCh-ER3 [ER, red] and mVenus-STIM2 [S2, green]). (G) mCerulean-MAPPER (mC-MAPPER, pseudocolored red) expressed in STIM2-KI cells and mV-STIM2 (S2, green), and overlay; line scans (position indicated in overlay image) show mC-MAPPER (red) and mV-STIM2 (green). All microscope images show representative cells from at least three experiments. (Scale bars, 5 µm.) a.u.: arbitrary units.

