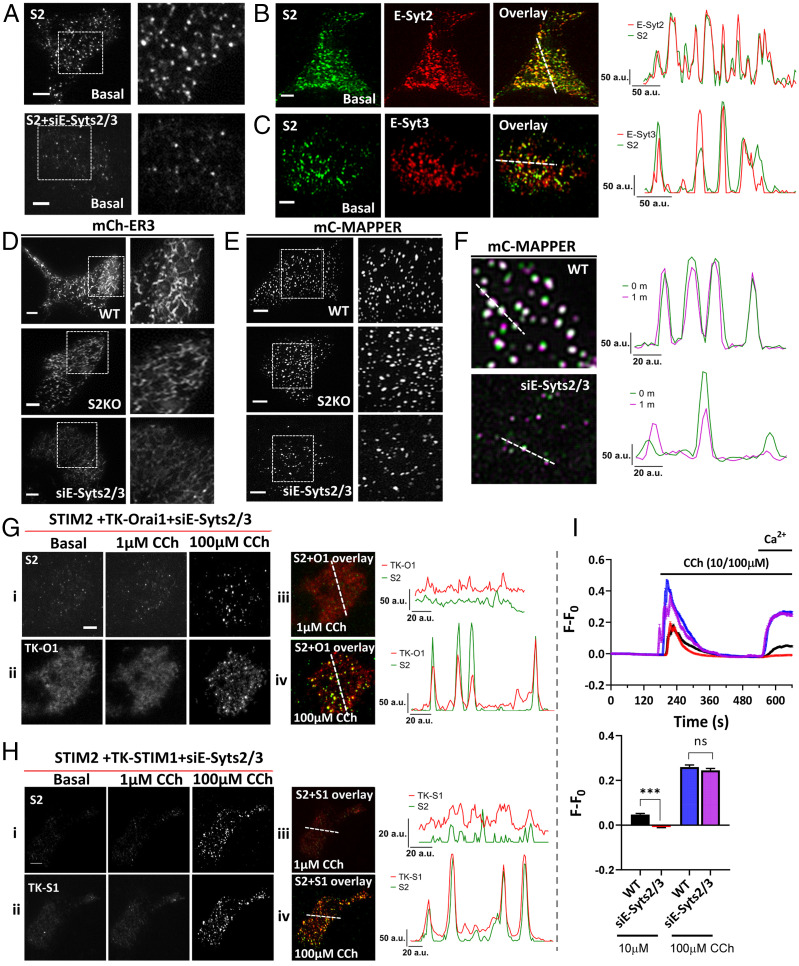
Fig. 3.
Role of extended synaptotagmins in localization of mVenus-STIM2 in ER–PM junction. (A) mV-STIM2 (S2) in control (Top) and siE-Syts2/3-transfected STIM2-KI cells (Bottom); enlargement of demarcated area on the Right. (B and C) Unstimulated STIM2-KI cells expressing (B) mCh-E-Syt2 (E-Syt2) or (C) mCh-E-Syt3 (E-Syt3). From Left to Right: S2 (green), E-Syt2 or E-Syt3 (red), and overlay of both proteins (colocalized clusters in yellow). Line scans (position indicated in overlay image) show overlapping mV-S2 and E-Syt clusters. (D) mCherry-ER3 (mCh-ER) or (E) mC-MAPPER expressed in WT (Top) or STIM2 knockout (S2KO, Middle) HEK293 cells, and WT cells treated with siE-Syts2/3 (Bottom). Enlargements of the area demarcated by a square box are shown on the Right. (F) Overlay images of mCerulean-MAPPER in WT cells (Top) and WT cells treated with siE-Syts2/3 (Bottom) under basal/unstimulated conditions (0/1m overlay) where white clusters represent immobile clusters. Line scans (position indicated in overlay image) show overlapping peaks for relatively immobile clusters. (G) STIM2-KI cells transfected with siE-Syts2/3 in addition to TK-Orai1-mCh; (i) mVenus-STIM2 (S2) and (ii) TK-Orai1-mCh (TK-O1) in unstimulated (Left), 1 µM CCh (Middle), and 100 µM conditions (Right). (iii and iv) Overlay of mV-STIM2 (S2, green) and TK-Orai1-mCh (TK-O1, red) following stimulation with 1 µM and 100 µM CCh, respectively. Line scans (position indicated on the overlay images) showing colocalized clusters of S2 and TK-O1. (H) Similar set of experiments as in G but with STIM2-KI cells expressing TK-mCh-STIM1 (TK-S1) + siE-Syts2/3. (I) Fura-2 fluorescence (F-F0, mean ± SEM) in control WT and siE-Syts2/3-treated WT cells stimulated with 10 µM or 100 µM CCh. Bar graphs show increase in fluorescence due to 1 mM Ca2+ entry. All TIRFM images show representative cells from at least three experiments, with CCh added at the 2-min time point. The Ca2+ imaging data are based on n > 150 cells in each set. Statistical significance was assessed using Student’s t tests for two groups and presented as not significant (ns: P = 0.4) and significant (***P < 0.001). a.u.: arbitrary units.

