Fig. 5.
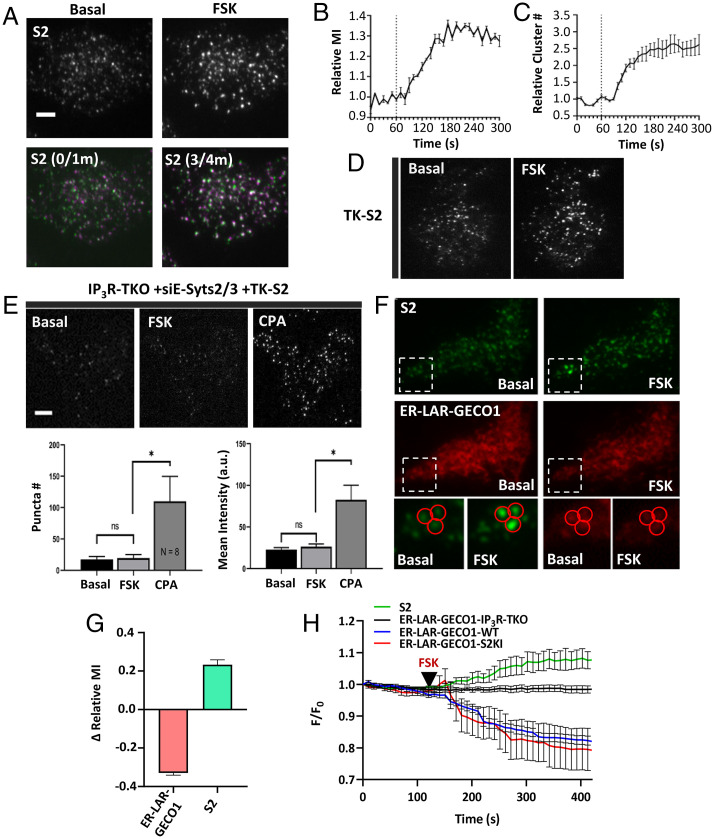
STIM2 clustering is determined by IP3R function. (A) mV-STIM2 (S2) clusters before and after 5 µM FSK stimulation (Top). Overlay images of mV-STIM2 at 0- and 1-min (0/1m) and 3- and 4-min (3/4m) time points (Bottom). (B) Increase of mV-STIM2 mean fluorescence intensity (MI) and relative number (cluster #) (C) in response to FSK treatment (added at 1-min time point, dotted line). (D) HEK293 cells expressing TK-YFP-STIM2 (TK-S2) before and after stimulation with FSK. (E) IP3R-TKO cells (lack all three IP3R subtypes), treated with siE-Syts2/3 and expressing TK-S2, before and after stimulation with 5 µM FSK and 25 µM CPA. Bar graphs showing number (puncta #) and mean intensity of TK-S2 clusters in the three conditions shown in the images (n = 8). Statistical tests were done using ANOVA with the significance presented as not significant (ns: P > 0.05) and significant (*P < 0.05). (F) STIM2-KI cells expressing ER-LAR-GECO1: S2 (Top) and ER-LAR-GECO1 (Bottom) under basal (unstimulated) and stimulated with FSK (5 µM). Enlargements of the region marked by a square are shown for visible camparisions. (G) Bar graph shows change in relative MI at the 5-min time point compared to basal (time point 1 min). Data are from three experiments and n = 43 immobile clusters). (H) Line graphs showing whole cell intensity of ER- LAR-GECO1 in WT, STIM2-KI (S2KI), and IP3R-TKO cells, and S2 fluorescence only in S2KI expressing ER-LAR-GECO1. Addition of 5 µM FSK is indicated by the black arrows. All TIRFM images show representative cells from at least three experiments. (Scale bars, 5 µm.)

