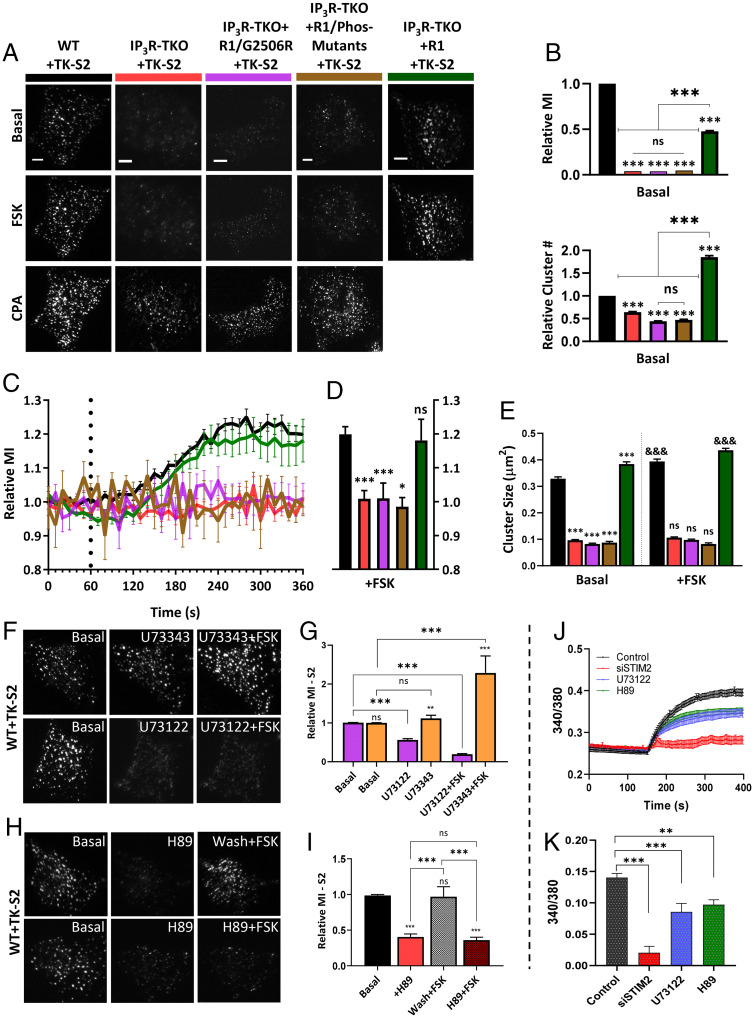
Fig. 6.
STIM2 clustering is determined by IP3R function. (A) HEK293 cells expressing TK-YFP-STIM2 (TK-S2): WT (black); IP3Rs-TKO (lack all three IP3R subtypes, red); IP3R-TKO cells stably expressing a pore-dead mutant of IP3R1 (IP3R-TKO/G2506R, magenta); IP3R-TKO cells expressing phosphorylation-deficient IP3R1 with S1589A and S1755A mutations (IP3R-TKO/Phos-mutants, brown); and IP3R-TKO cells stably expressing IP3R1 (IP3R-TKO + IP3R1, green), respectively, either unstimulated (basal) or consecutively stimulated with 5 µM FSK and 25 µM CPA. (B) Bar graphs show relative MI (Top) and relative number (Bottom) of TK-S2 clusters in basal condition for all cell types in A. (C) Time-dependent increases in relative MI of TK-S2 clusters calculated from cells shown in A. (D) Bar graphs show relative MI at the 5-min time point in C. (E) Bar graph showing relative size of TK-S2 clusters for the basal and FSK-treated cells in A. Basal values for all IP3R-TKO cells were compared to WT, while FSK values for WT and all IP3R-TKO cells were compared with their basal counterparts. (F) WT cells expressing TK-S2 showing clusters at basal (Left) and poststimulation with either 5 µM U73343 (inactive compound, Middle) and U73343 with 5 µM FSK (Right). Bottom set shows similar experiment done with the active PLC inhibitor, U73122 (5 µM). (G) Bar graphs showing relative MI at basal and after stimulation with compounds as indicated in F. (H) TK- S2 clusters in HEK293 cells under basal (Left), poststimulation with 5 µM H89 (Middle), and poststimulation with 5 µM FSK (Right). Treatment with FSK was either with a washout (wash) of H89 (Top) or without (Bottom). (I) Bar graphs showing relative MI at basal and after stimulation with compounds as indicated in H. Statistical tests were done using ANOVA with nonsignificant results presented ns: P > 0.05 and various levels of statistical significance as *P < 0.05, **P < 0.01, and &&&/***P < 0.001. All TIRFM images show representative cells from at least three experiments. (Scale bars, 5 µm.) (J) Fura-2 fluorescence measurements presented as F-F0 (mean ± SEM) of S2KI (control, black) and S2KI + siSTIM2 cells (red), S2KI + U73122 (blue), S2KI + H89 (green), treated with 1 mM CaCl (addition at 150s). (K) Bar graphs show change in F-F0 due to 1 mM Ca2+ entry (four independent experiments with n > 170 cells).

