Fig. 3.
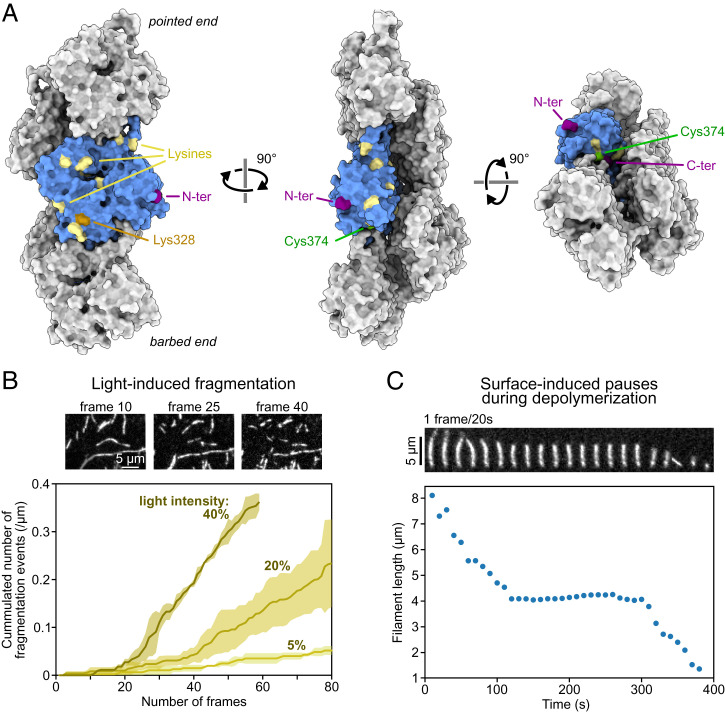
Surface anchoring and fluorescent labeling are common sources of artifacts. (A) Five actin subunits in a filament based on the cryo-EM structure of ADP-actin filaments from ref. 103 (Protein Data Bank ID code 6DJO) shown from different angles using ChimeraX (104). One actin subunit is colored in blue, and the amino acids commonly targeted for labeling with synthetic dyes are highlighted. Actin can also be fused to a fluorescent protein at its C or N terminus (for cell studies mostly). (B) Fragmentation, induced by illumination, of actin filaments (10% labeled with AlexaFluor-568 on surface lysines). Images are acquired with the power of the lamp (Xcite, Lumen Dynamics) set at 40% of its maximum. The curves were obtained by observing the severing of ≥10 filaments per experiment. Lines and shaded surfaces represent the average and SD over three independent experiments. Note the lag, which indicates that photo-induced severing is not a simple first-order reaction. (C) Depolymerization of an actin filament (10% labeled with AlexaFluor-488 and 1% biotinylated actin subunits on surface lysines) anchored to a streptavidin-functionalized coverslip, at 25 °C. Filament length was measured using the JFilament ImageJ plugin (105). A pause occurs when the depolymerizing barbed end reaches an anchoring point, which can be identified as a static and brighter point along the filament. In B and C, filaments are made with rabbit alpha-skeletal actin and imaged in the same buffer (5 mM Tris⋅HCl, pH 7.4, 50 mM KCl, 1 mM MgCl2, 0.2 mM EGTA, 0.2 mM ATP, 10 mM DTT, 1 mM DABCO) supplemented with 0.3% (B) and 0.5% (C) methylcellulose (4,000 cP at 2%). Data from B and C can be found in Dataset S1. EGTA, ethylene glycol tetraacetic acid; DTT, dithiothreitol; DABCO, diazabicyclooctane.

