Fig. 4.
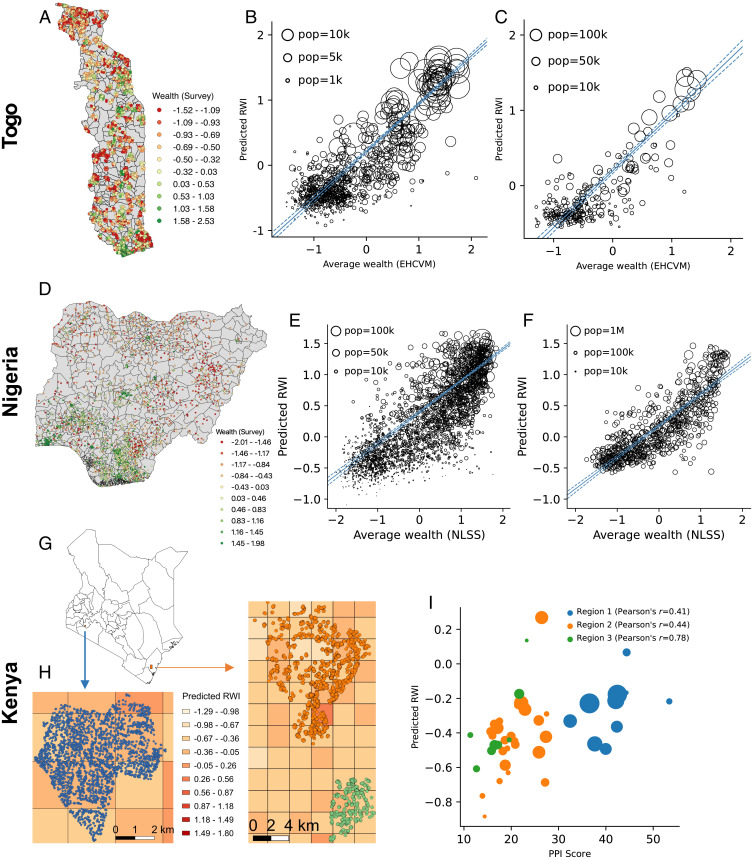
Validation with independently collected microdata in Togo, Nigeria, and Kenya. (A) Map of Togo showing locations of surveyed households (jitter added to map to preserve household privacy). (B) Scatterplot of the predicted RWI of each grid cell against the average wealth of the grid cell, as reported in a nationally representative government survey. Points are sized by population. Population-weighted regression lines are in blue; 95% confidence intervals are shown with dashes. (C) Scatterplot of predicted RWI against average wealth of each canton, the smallest administrative unit in Togo. (D) Map of surveyed households in Nigeria (jitter added). (E) Scatterplot of predicted RWI against average wealth of each grid cell. (F) Scatterplot of predicted RWI against average wealth of each local government area (LGA). (G) Map of Kenya showing the regions surveyed by GiveDirectly. (H) Enlargement of the three survey regions, showing the location of each of 5,703 surveyed households. Colors of background grid cells indicate RWI predicted from the ML model. In both enlargements, the width of the grid cell is 2.4 km. (I) Scatterplot of the predicted RWI of each grid cell (y axis) against the average PPI of all surveyed households in the grid cell (x axis). Points are sized by the number of households in the grid cell and colored by region.

