Fig. 1.
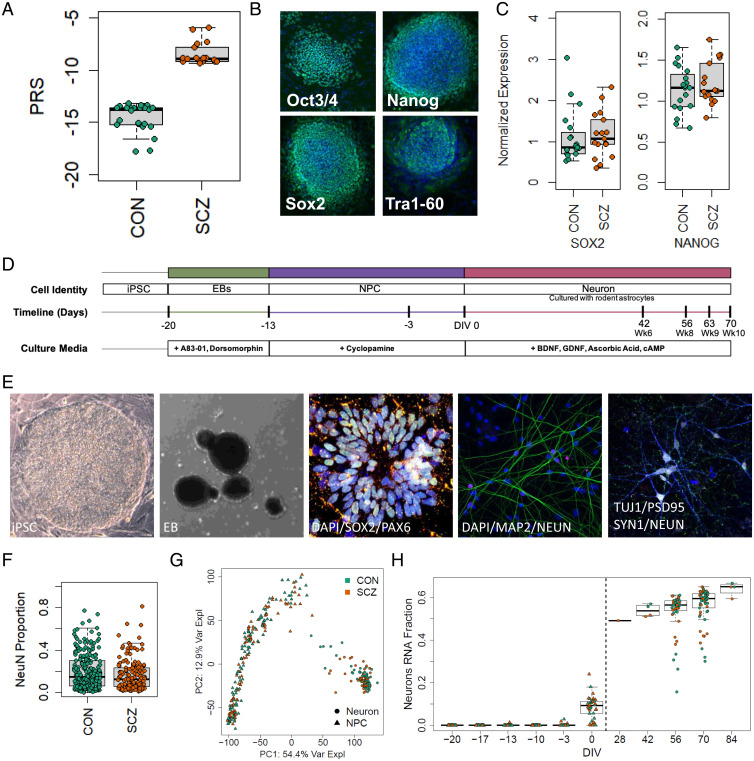
Description of experimental lines and experiment overview. (A) PRS of neurotypical controls and individuals with SCZ included in this study (CON, −14.829 ± 1.535, n = 15; SCZ, −8.375 ± 1.1736, n = 13; P = 1.78E-12). (B) Pluripotency of reprogrammed lines was verified by identification of NANOG+, SOX2+, OCT3/4+, and TRA-1-60+ colonies colocalized with DAPI using immunocytochemistry. (C) qPCR quantification of stem cell markers SOX2 (CON, 1.152 ± 0.151; SCZ, 1.162 ± 0.133; P = 0.96, n = 35 from 28 genomes) and NANOG (CON, 1.133 ± 0.062; SCZ, 1.222 ± 0.063; P = 0.32, n = 35 from 28 genomes), normalized to embryonic stem cell line H1. (D) hiPSCs were differentiated into neurons in multiple batches. (E) Representative images of induced pluripotent stem cell colony (bright field), EB (bright field), immunofluorescence of neural rosettes at 2 d, DAPI (blue), SOX2 (green), PAX6 (red); immunofluorescence of neurons at DIV56, DAPI (blue), MAP2 (green), NeuN (red); immunofluorescence of neurons showing synaptic puncta at DIV70, Tuj1 (blue), PSD95 (green), SYNAPSIN1 (red), NeuN (white). (F) Quantification of the proportion of NeuN+ cells to the number of DAPI-stained nuclei shows no difference in neuronal differentiation or survival by diagnosis (CON, 0.186 ± 0.01, n = 229 cultures from 18 lines; SCZ, 0.167 ± 0.012, n = 156 cultures from 14 lines; P = 0.43). (G) PCA of RNA-seq at multiple time points during culture differentiation (hiPSC, NPC, DIV56, and DIV70 neurons) demonstrates that the largest source of variation (top PC, PC1, representing 54.4% of the variance explained) corresponds to cell state. (H) The fraction of RNA attributed to neurons increases across differentiation stages in CON and SCZ lines.

