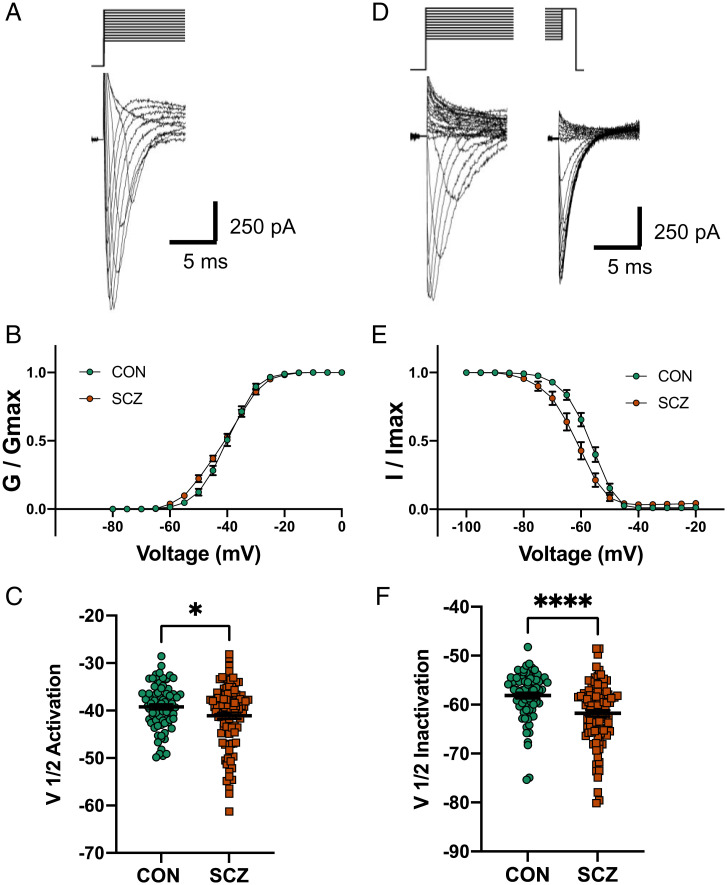
Fig. 3.
Altered Na+ channel activation and inactivation in six SCZ compared with seven CON. (A) Representative Na+ current traces in response to voltage steps (−100 to +20 mV). (B) Voltage dependence of steady-state activation of Na+ channels in SCZ and CON neurons. (C) Summary data showing a significantly hyperpolarized shift in the activation of Na+ channels in SCZ neurons versus CON neurons (CON, V1/2 = −39.2 ± 0.6 mV; SCZ, V1/2 = −41.1 ± 0.7 mV; Delta = 1.9 mV, *P = 0.039, n = 173 from 13 genomes). (D) Representative Na+ current traces in response to a steady-state inactivation protocol (initial voltage steps from −130 to 20 mV; test voltage steps, −20 mV) to measure channel inactivation. (E) Voltage dependence of steady-state inactivation of Na+ channels in SCZ and CON neurons. (F) Summary data showing a significantly hyperpolarized shift in the inactivation of Na+ channels in SCZ neurons versus CON neurons (CON, V1/2 = −58.1 ± 0.6 mV; SCZ, V1/2 = −61.8 ± 0.7 mV; Delta = 3.7 mV, ****P < 0.0001, adjusted P < 0.0035, n = 162 from 13 genomes). All data represented as mean ± standard error of the mean.

