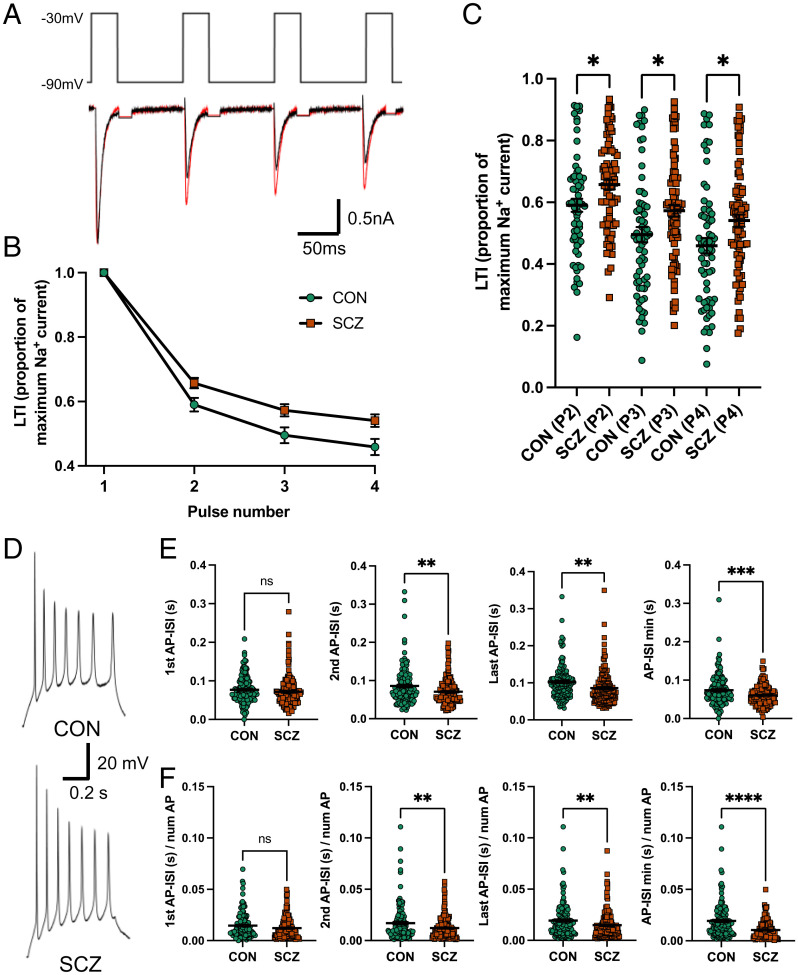
Fig. 4.
Reduced inactivation in SCZ is reflected in the AP-ISI in 13 SCZ compared with 15 CON. (A) Representative Na+ currents in response to four consecutive voltage steps from a holding potential of −90 to −30 mV in an SCZ (red) and CON (black) neuron. Capacitance transients are blanked out. (B) Group data of LTI. (C) Summary LTI of Na+ currents for each voltage step normalized by the currents generated by the first voltage step showing reduced LTI in SCZ compared with CON neurons (CON P2/P1 = 0.59 ± 0.02; SCZ P2/P1 = 0.66 ± 0.024, post hoc P = 0.024; CON P3/P1 = 0.50 ± 0.02; SCZ P3/P1 = 0.57 ± 0.02, *P = 0.023, post hoc P = 0.023; CON P4/P1 = 0.46 ± 0.03; SCZ P4/P1 = 0.54 ± 0.021, post hoc P = 0.021; mixed-effects ANOVA P < 0.0001, n = 148 from 11 genomes). (D) Example AP trains generated in SCZ and CON neurons. (E) Group data showing the AP-ISI for the second (CON 0.086 ± 0.004 s, SCZ 0.071 ± 0.003 s, **P = 0.0018, n = 297 from 28 genomes), last (CON 0.102 ± 0.004 s, SCZ 0.086 ± 0.004 s, **P = 0.002, n = 297 from 28 genomes), and minimum AP-ISI (CON 0.074 ± 0.003 s, SCZ = 0.060 ± 0.002 s, ***P = 0.0006, n = 297 from 28 genomes), but not the first AP-ISI (CON 0.077 ± 0.003 s, SCZ = 0.07 ± 0.003 s, P = 0.245, n = 297), are significantly shorter in SCZ versus CON neurons. (F) Group data showing the second (CON 0.017 ± 0.001 s, SCZ = 0.012 ± 0.0008 s, **P = 0.0042, n = 297 from 28 genomes), last (CON 0.0193 ± 0.001 s, SCZ 0.015 ± 0.001 s, **P = 0.0098, n = 297 from 28 genomes), and minimum AP-ISI (CON 0.019 ± 0.001 s, SCZ 0.010 ± 0.0007 s, ****P < 0.0001, n = 297 from 28 genomes), but not the first AP-ISI (CON 0.015 ± 0.001 s, SCZ 0.012 ± 0.0008 s, P = 0.062, n = 297 from 28 genomes), remain significantly reduced in SCZ versus CON neurons when normalized by the number of APs. All data represented as mean ± standard error of the mean. ns, not significant.

