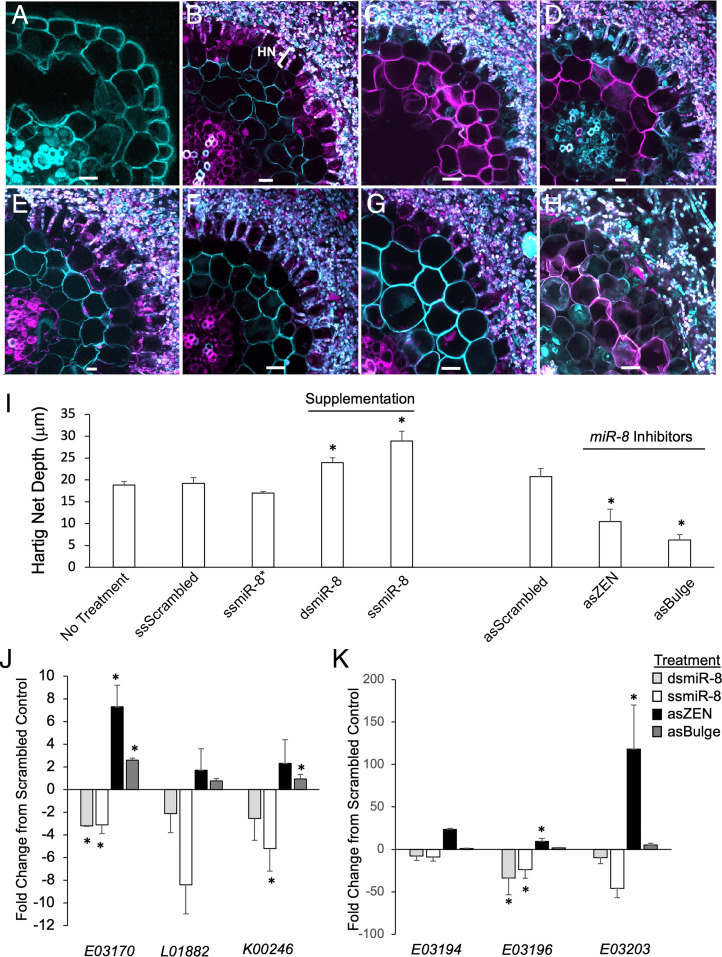
Fig. 3.
Supplementation and disruption of Pmic_miR-8 alters growth of the fungus into the apoplastic space of E. grandis roots and expression of host genes. (A) Representative transverse cross-section of an axenically grown E. grandis lateral root. P. microcarpus mycorrhizal root tip on E. grandis when sprayed for 1 wk with the following: scrambled control RNA with the Hartig net (HN) penetration marked (B); as single-stranded, mature Pmic_miR-8* (C); sense ds, mature Pmic_miR-8 (D); sense single-stranded, mature Pmic_miR-8 (E); scrambled, ZEN-tagged miRNA inhibitor (F); single-stranded, ZEN-tagged as Pmic_miR-8 inhibitor (G); and single-stranded as Pmic_miR-8 with designed bulge mismatch at nucleotides 10 to 11 (H). All images are representative of six biological replicates. (Scale bar, 10 μm.) (I) Average measured HN depth of P. microcarpus in E. grandis roots with either no spray treatment (No Treatment) or miRNA sense scrambled (ssScrambled); as single-stranded, mature Pmic_miR-8* (ssmiR-8*); ds, mature Pmic_miR-8 (dsmiR-8); sense single-stranded, mature Pmic_miR-8 (ssmiR-8); scrambled as inhibitor (asScrambled); single-stranded, ZEN-tagged as Pmic_miR-8 inhibitor (asZEN); and single-stranded as Pmic_miR-8 with designed bulge mismatch at nucleotides 10 to 11 (asBulge). n = 6, ±SE; * indicates significant difference from scrambled control (P < 0.05; Student’s t test). (J) qPCR of relative expression of the top three putative Pmic_miR-8–targeted gene transcripts (based on in silico prediction) in E. grandis mycorrhizal root tips either treated with sense ds, mature Pmic_miR-8 (light gray bars); sense single-stranded, mature Pmic_miR-8 (white bars); single-stranded, ZEN-tagged as Pmic_miR-8 inhibitor (black bars); and single-stranded as Pmic_miR-8 with designed bulge mismatch at nucleotides 10 to 11 (dark gray bars). n = 3 ± SE. (K) qPCR of relative expression of three putative Pmic_miR-8–targeted gene transcripts (based on homology to Eucgr.E03170) in E. grandis mycorrhizal root tips treated and colored as in J. n = 3 ± SE; * indicates significant difference from scrambled control (P < 0.05; Student’s t test).

