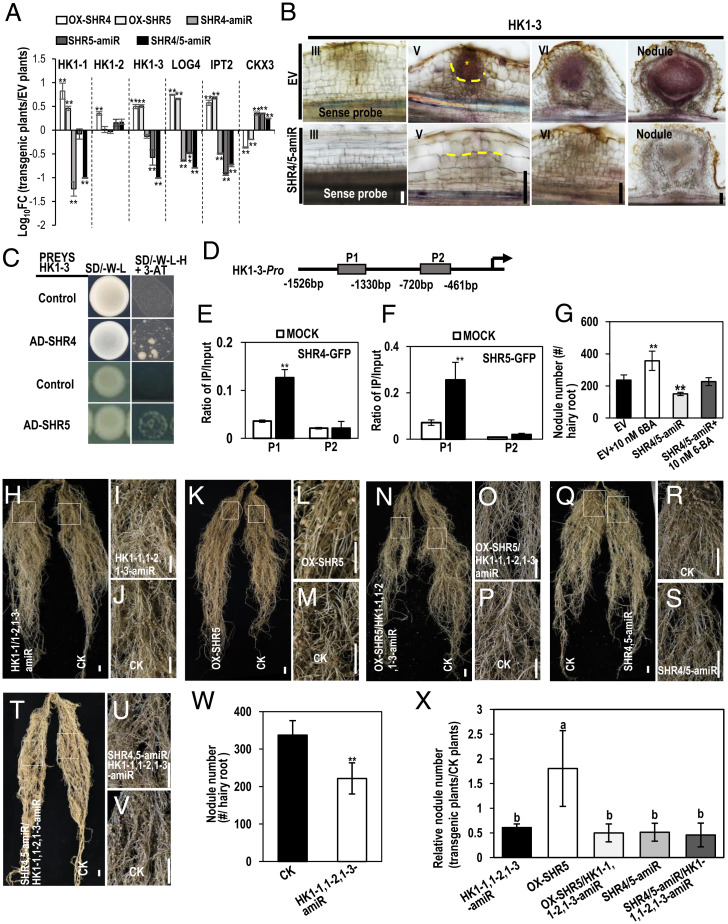
Fig. 4.
GmSHR4 and GmSHR5 function upstream of cytokinin signaling during nodulation. (A) The relative transcript of cytokinin genes in EV, OX-GmSHR4, OX-GmSHR5, GmSHR4-amiR, GmSHR5-amiR, and GmSHR4/5-amiR lines. The RNA was extracted from the noninoculated roots. GmEF1α (accession no. X56856) was used as the internal control. Significant differences are observed between transgenic plants and EV plants. (**P < 0.01; Student’s t test). Error bars represent SD. (B) In situ hybridization of GmHK1-3 in EV and GmSHR4/5-amiR lines. Yellow asterisk marks the division in outer ground tissues. Yellow dashed line defines the division in outer ground tissues (n ≥ 10). (C) Y1H assays showing the interaction between GmSHR4/5 and HK1-3 promoter. Promoters in pHIS 2 vector and pGADT7–GmSHR4/5 were cotransformed into yeast strain Y187. The empty pGADT7 vector (AD) was used as the negative control. The yeast clones were grown on SD/–Leu/–His/–Trp (–L–W–H) medium with 60 mM 3-AT (n = 3). (D) Regions of the GmCYCD6;1-6 promoter were used for ChIP (P1 to P2) assays. (E and F) The ratio of bound promoter fragments versus total input detected by qRT-PCR after immunoprecipitation of GFP-GmSHR4/5 by GFP antibodies. Data are means (± SE), n = 3. (G) The exogenous 6-BA can rescue the defective nodulation in GmSHR4/5-amiR roots. Shown is nodule number in roots with 10 nM 6-BA treatment (n ≥ 20). (H–V) Nodulation in GmHK1-1,1-2,1-3-amiR, OX-GmSHR5/GmHK1-1,1-2,1-3-amiR roots and GmSHR4/5-amiR/GmHK1-1,1-2,1-3-amiR roots. (I and J) Close-up view of the boxed areas in H. (L and M) Close-up view of the boxed areas in K. (O and P) Close-up view of the boxed areas in N. (R and S) Close-up view of the boxed areas in Q. (U and V) Close-up view of the boxed areas in T. (W and X) Nodule number. The roots were examined at 16 dai with rhizobia. Significant differences are observed between transgenic plants and CK plants (**P < 0.01, *P < 0.05; Student’s t test). Error bars represent SD. Different letters indicate significant differences between genotypes (P < 0.05 by Tukey’s test). (Scale bars, 1 cm.) CK, control check.

