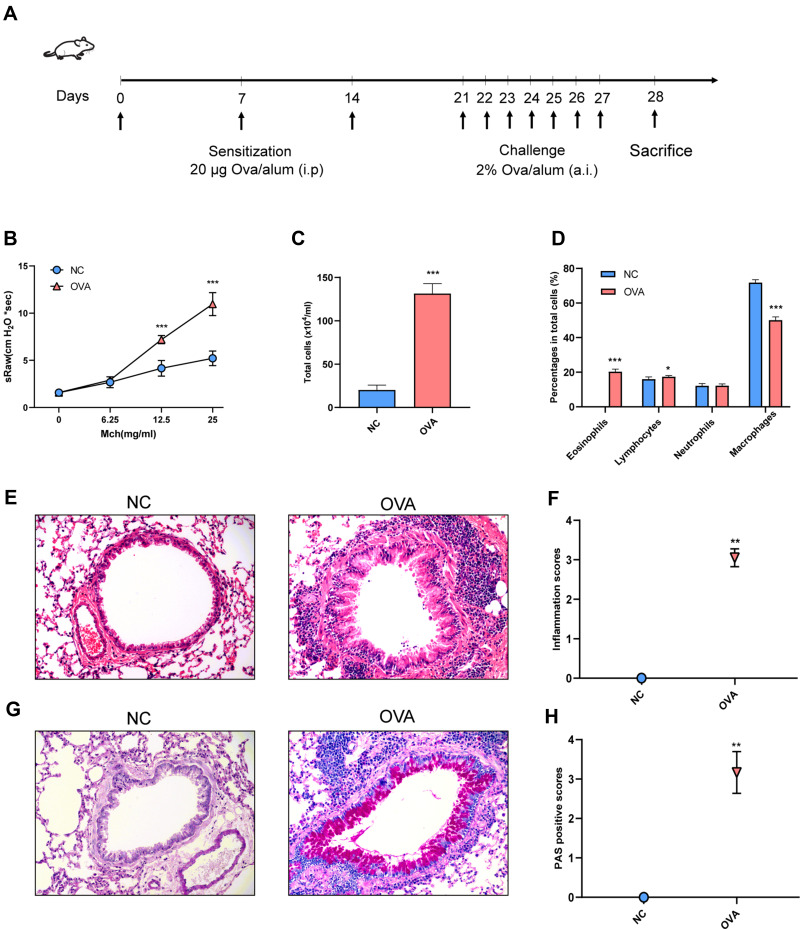
Figure 1.
Airway inflammation and AHR of OVA-induced allergic asthma mice. (A) Experimental protocol. (B) Airway resistance to increased doses of Mch (mg/mL), presented as sRaw. (C) Total inflammatory cell count in BALF. (D) The mean percentage of eosinophils, lymphocytes, neutrophils and macrophages in BALF. (E) Representative HE-stained pictures of lung. (F) Inflammation scores. (G) Representative PAS-stained pictures of lung. (H) PAS-positive scores. Randomly selected three areas of each sample were used for semi-quantification. sRaw: specific airway resistance. (E and G) Magnification, ×200. Data are represented as expressed as mean ± SD (n=6). *p < 0.05, **p < 0.01, and ***p < 0.001 versus the normal control group.
Abbreviations: Mch, Methacholine; BALF, Bronchoalveolar lavage fluid cell; NC, normal control group; OVA, asthma model group.

