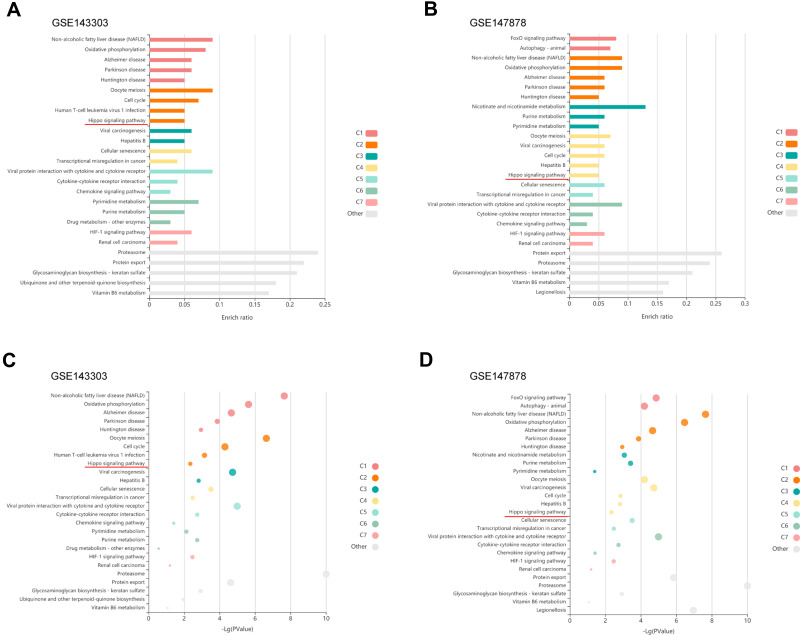
Figure 5.
Validation of downregulation of the Hippo signaling pathway in endobronchial biopsies from asthma patients with GEO datasets. (A) Enrichment plots of Hippo signaling pathway; enriched in the GSE143303. (B) Enrichment plots of Hippo signaling pathway; enriched in the GSE147878. (C) Bubble plot shows -Log (P value) in the GSE143303. (D) Bubble plot shows -Log (P value) in the GSE147878.

