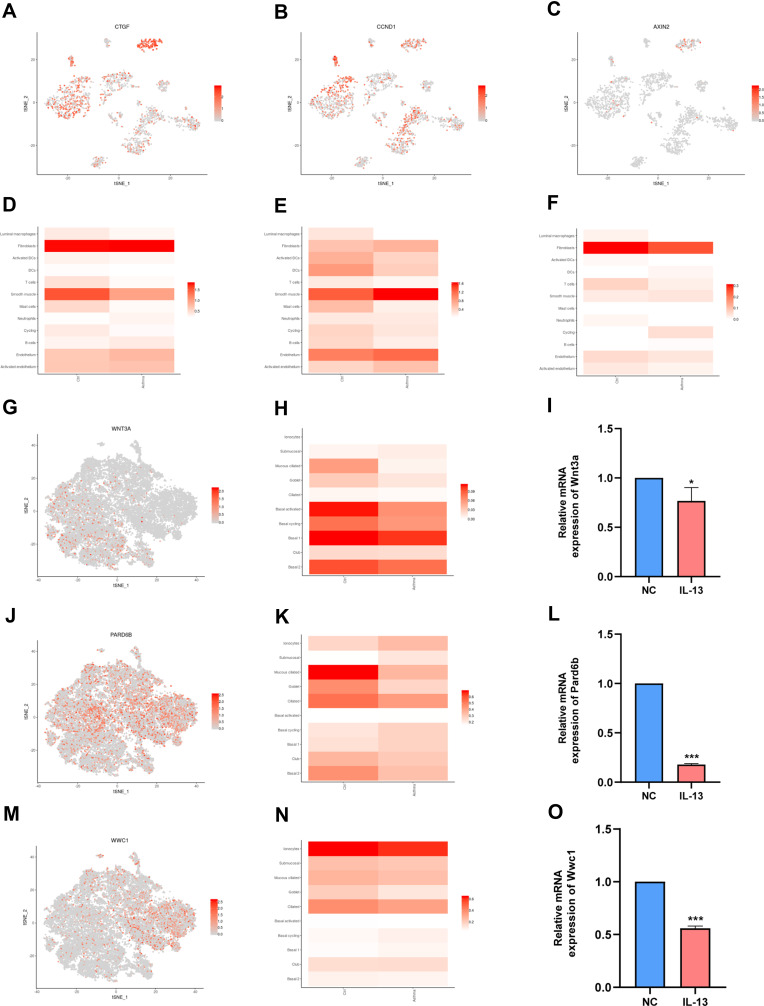
Figure 6.
Hippo signaling pathway is related to the immune cell and epithelial cells identified in the human airway. (A) t-SNE displaying distribution of Ctgf in airway. (B) t-SNE displaying distribution of Ccnd1 in airway. (C) t-SNE displaying distribution of Axin2 in airway. (D) Bar plot displaying distribution of Ctgf in airway. (E) Bar plot displaying distribution of Ccnd1 in airway. (F) Bar plot displaying distribution of Axin2 in airway. (G) t-SNE displaying distribution of Wnt3a in airway epithelium. (H) Bar plot displaying distribution of Wnt3a in airway epithelium. (I) Relative mRNA expression of Wnt3a in BEAS-2B cells. (J) t-SNE displaying distribution of Pard6b in airway epithelium. (K) Bar plot displaying distribution of Pard6b in airway epithelium. (L) Relative mRNA expression of Pard6b in BEAS-2B cells. (M) t-SNE displaying distribution of Wwc1 in airway epithelium. (N). Bar plot displaying distribution of Wwc1 in airway epithelium. (O). Relative mRNA expression of Wwc1 in BEAS-2B cells. NC: normal control group. IL-13: IL-13-stimulated group. Data are represented as expressed as mean ± SD (n=3). *p < 0.05, and ***p < 0.001 versus the normal control group.
Abbreviation: BEAS-2B, human bronchial epithelial cell line.

