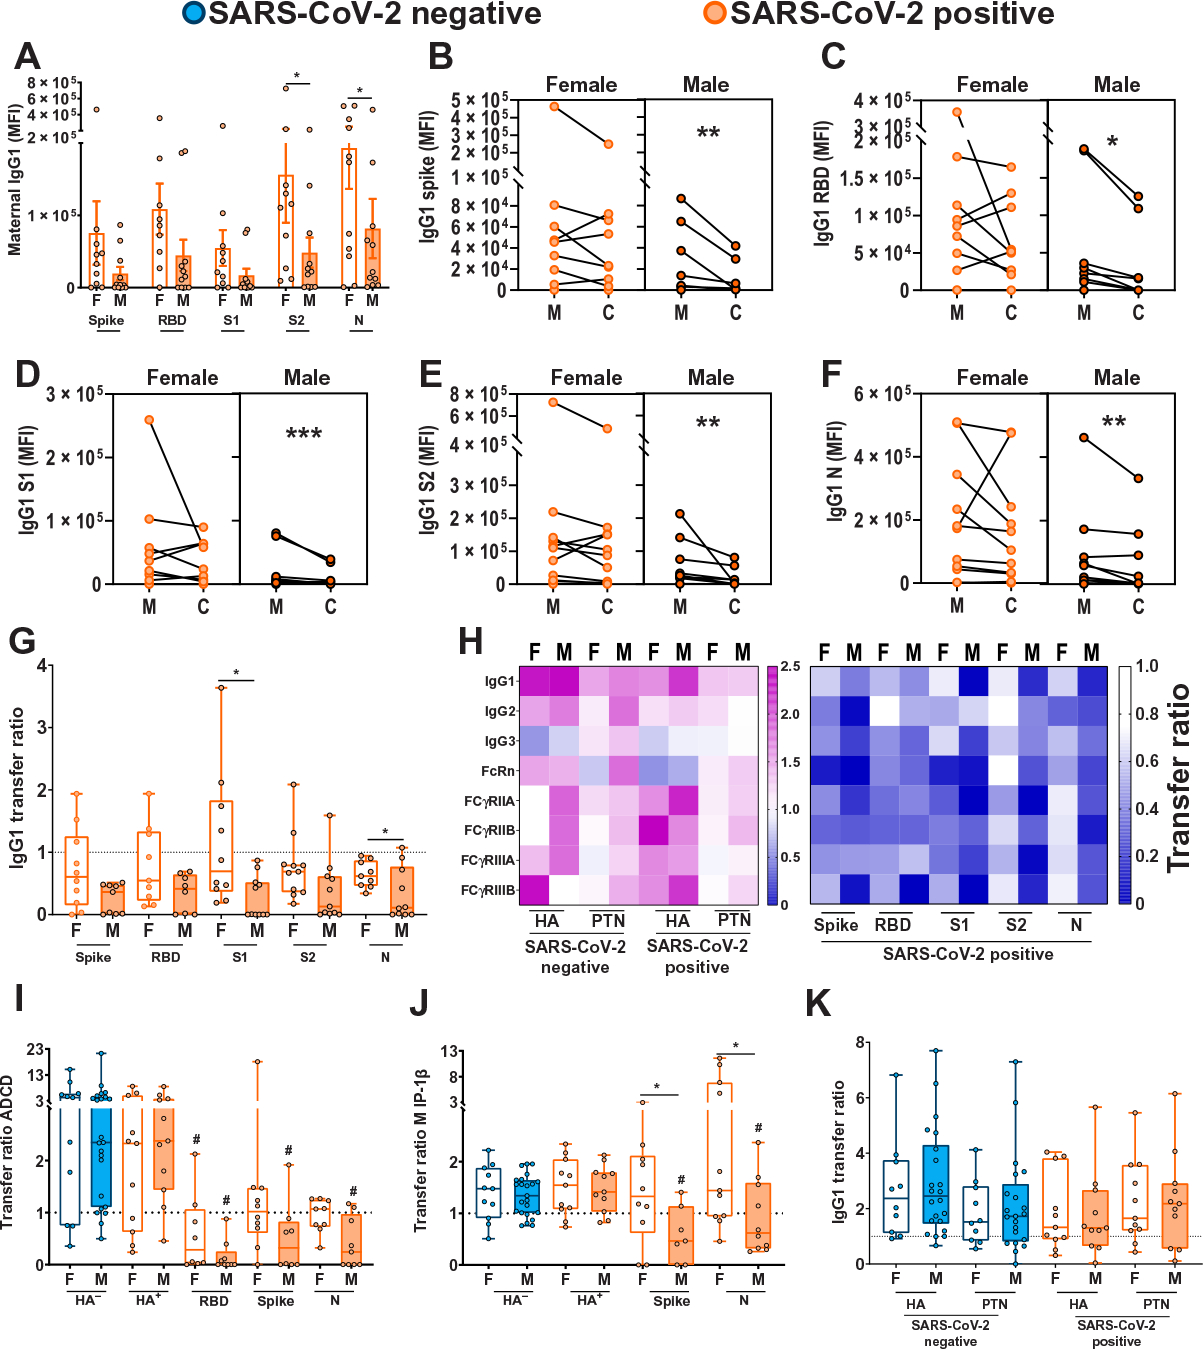
Fig. 1. SARS-CoV-2–positive mothers with male fetuses demonstrate reduced maternal titers and placental transfer of SARS-CoV-2–specific antibodies compared to those with female fetuses.

(A) Bar graphs depict spike protein–, RBD-, S1-, S2-, and N protein–specific maternal IgG1 titers (n = 11 per group). F, female fetus; M, male fetus. Differences across groups were assessed by two-way ANOVA followed by Bonferroni’s post hoc analyses. There was a main effect of fetal sex on maternal IgG1 titers. MFI, median fluorescence intensity. *P < 0.05. (B to F) Dot plots showing relative spike protein– (B), RBD- (C), S1- (D), S2- (E), and N protein–specific (F) maternal blood (M) and cord blood (C) titers of IgG1 (n = 11 per group). Female neonates of SARS-CoV-2–positive mothers are shown in light orange. Males born to SARS-CoV-2–positive mothers are shown in dark orange. All values reflect phosphate-buffered saline (PBS) background correction. Group differences were assessed by Wilcoxon matched-pairs signed rank test. *P < 0.05, **P < 0.01, and ***P < 0.001. (G) Box and whisker plots show the placental transfer ratios (cord:maternal ratios) for IgG1 against the SARS-CoV-2 antigens spike protein, RBD, S1, S2, and N. SARS-CoV-2–positive maternal status is shown in orange [female (F), open bars; male (M), shaded bars]. All values are PBS background corrected (n = 11 per group). Differences across groups were assessed by Kruskal-Wallis test followed by Dunn’s post hoc analyses. Dotted line denotes a transfer ratio of 1 or 100%. *P < 0.05. (H) Heatmap depicting the median PBS background–corrected cord:maternal transfer ratio of HA, PTN, spike protein, RBD, S1, S2, and N protein across all antibody subclasses and Fc receptor binding profiles in both SARS-CoV-2–negative and SARS-CoV-2–positive maternal:neonate dyads. (I and J) Box and whisker plots depicting transfer ratios (cord:maternal) for HA-, RBD-, spike protein–, or N protein–specific antibodies (n = 11 to 23 per group) mediating antibody-dependent complement deposition [ADCD (I)] and macrophage inflammatory protein-1β (MIP-1β) expression (J). SARS-CoV-2–negative maternal status is shown in blue (female, open bars; male, shaded bars), and SARS-CoV-2–positive maternal status is shown in orange (female, open bars; male, shaded bars). HA− indicates presence of antibodies specific to HA antigen in SARS-CoV-2–negative pregnancies, HA+ indicates presence of antibodies specific to HA antigen in SARS-CoV-2–positive pregnancies. Differences across groups were assessed by Kruskal-Wallis test followed by Dunn’s post hoc analyses. For each SARS-CoV-2 antigen, post hoc analyses were performed against the HA-specific activity using the matched SARS-CoV-2–positive dyad. #P < 0.01 compared to HA transfer ratio for SARS-CoV-2–positive samples of that sex, and *P < 0.01 compared to indicated group. (K) The box and whisker plots show the transfer ratios (cord:maternal ratio) for IgG1 against HA and PTN in maternal:neonate dyads from either SARS-CoV-2–negative or SARS-CoV-2–positive pregnancies (n = 11 to 23 per group). SARS-CoV-2 negative are shown in blue (female, open bars; male, shaded bars), and SARS-CoV-2 positive are shown in orange (female, open bars; male, shaded bars). Differences across groups were assessed by Kruskal-Wallis test followed by Dunn’s post hoc analyses. In (I) to (K), dotted line denotes transfer ratio of 1 or 100%. *P < 0.05. For box and whisker plots in (A), (G), and (I) to (K), the box extends from the 25th to 75th percentile, the whiskers depict minimum and maximum, and horizontal line depicts the median.
