
Fig. 5. Placental gene expression affects transplacental antibody transfer.
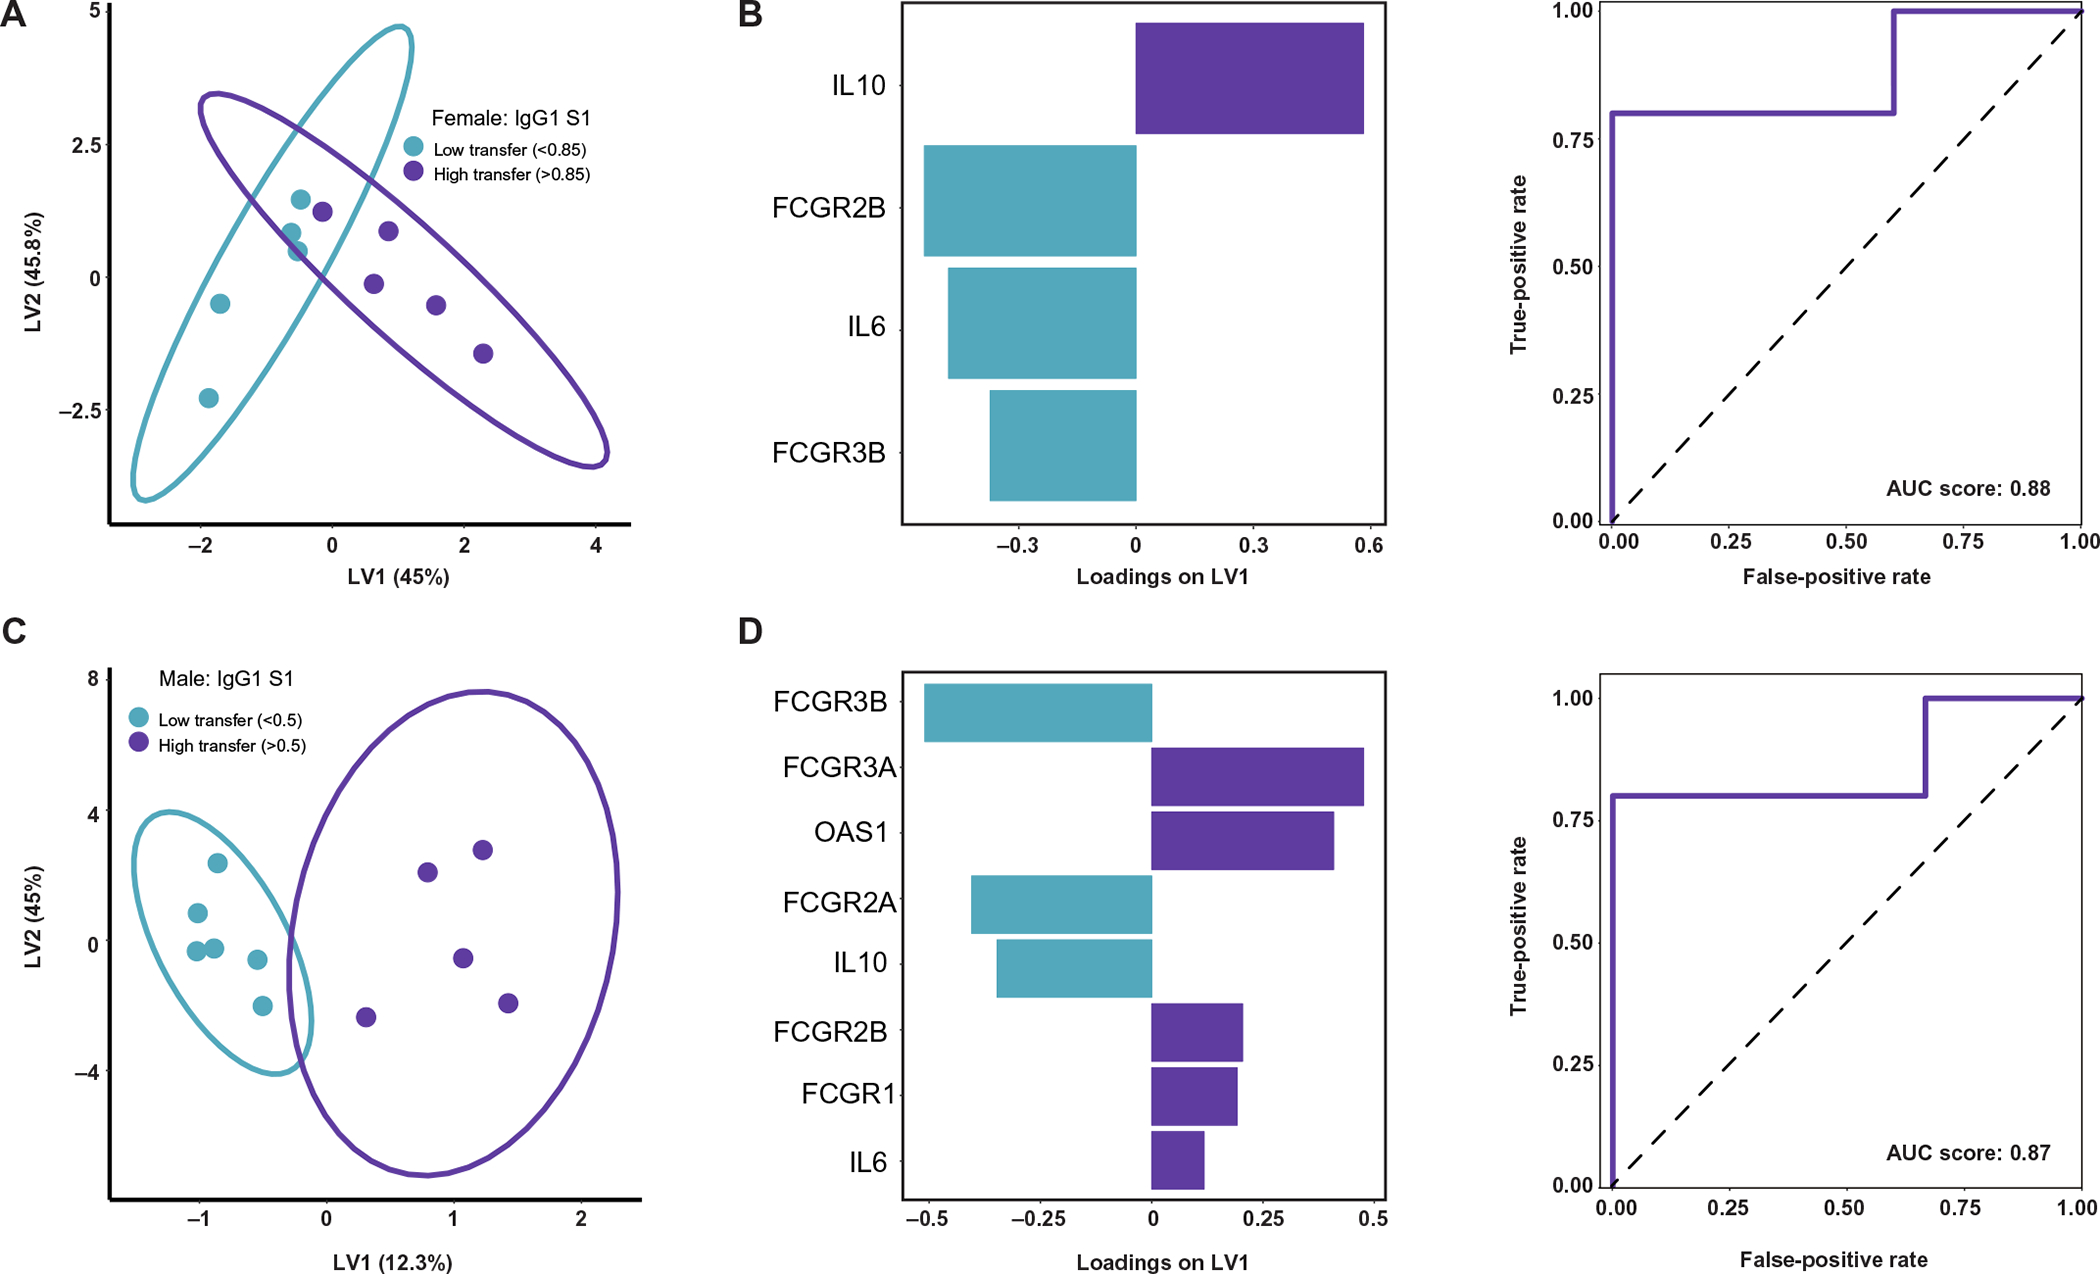
(A) O-PLSDA model classifying relatively low (ratio < 0.85) versus high (ratio > 0.85) IgG1 S1 transfer to female neonates based on placental gene expression. The model was built on gene expression features after LASSO feature selection. Each dot represents one mother-cord pair. (B) Gene expression feature loadings on the LV1 for the female model in (A). Bar color corresponds with which transfer classification (low versus high) is characterized by enriched expression of that gene, with blue bars enriched in low transfer and purple bars enriched in high transfer. The receiver operating characteristic (ROC) curve (solid purple line) for this model quantifies the accuracy in classifying IgG1 S1 transfer to female neonates after leave-one-out cross-validation. The area under the curve (AUC) score is reported. The black dashed line represents the expected performance of a random model (AUC score = 0.5). (C) O-PLSDA model classifying relatively low (ratio < 0.5) versus high (ratio > 0.5) IgG1 S1 transfer to male neonates based on placental gene expression. The model was built on gene expression features after LASSO feature selection. (D) Gene expression feature loadings on the LV1 for the male model in (C). Bar color corresponds with which transfer classification (low versus high) is characterized by enriched expression of that gene, with blue bars enriched in low transfer and purple bars enriched in high transfer, respectively. The ROC curve (solid purple line) for this model quantifies the accuracy in classifying IgG1 S1 transfer to male neonates after leave-one-out cross-validation. The AUC score is reported with black dashed line representing the expected performance of a random model (AUC score = 0.5).