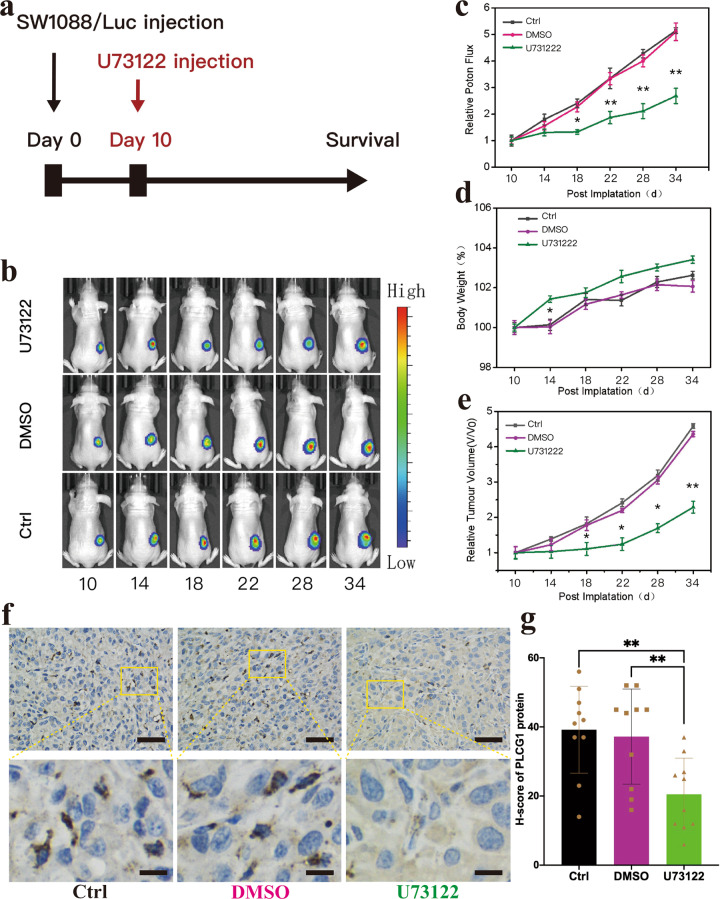
Fig. 6. U73122 suppressed tumor growth in mouse subcutaneous xenograft models.
a Time course of U731222 treatment in the mouse subcutaneous SW1088/Luc xenograft model. b Representative images of tumor bioluminescence intensity after SW1088/Luc inoculation after 10, 14, 18, 22, 28, and 34 days. c The statistical results of the photon flux of SW1088/Luc xenograft models. d The statistical results of the body weights of SW1088/Luc xenograft models. e The statistical results of the relative tumor volume of SW1088/Luc xenograft models. f Representative IHC image of samples from xenograft model in different groups (upper); Magnification of yellow rectangular area (lower). Scale bar = 50 μm (upper three images) or 10 μm (lower three images). g The statistical results of the H-score of PLCG1 protein. **p < 0.01, *p < 0.05. Data are expressed as the mean ± SD.

