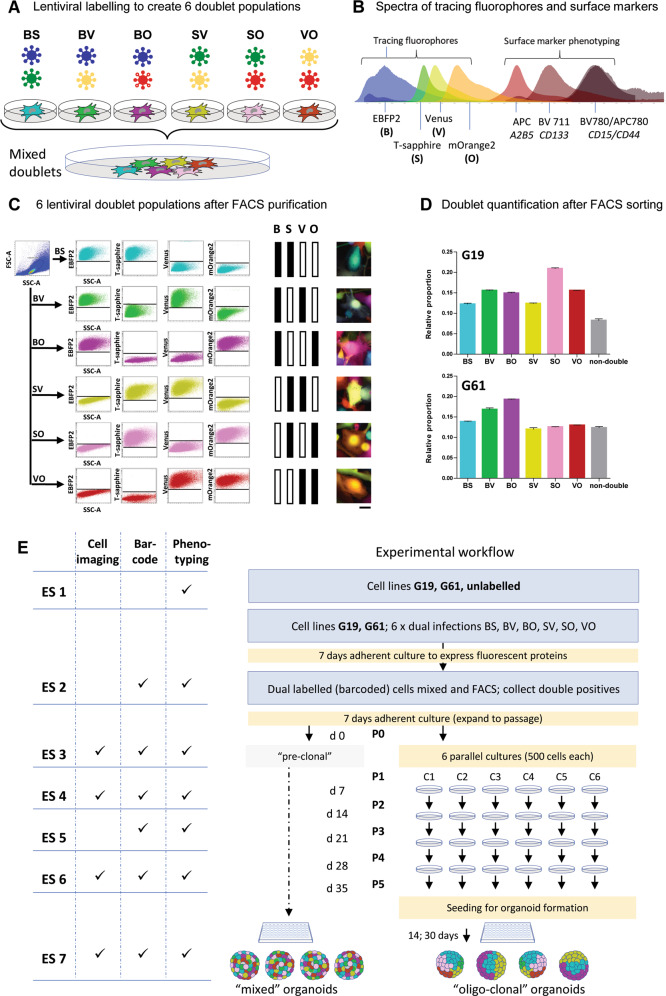
Fig. 1. Lentiviral labelling protocol for barcoding of hGICs.
A Combinations of four lentiviruses expressing EBFP2 (B [blue]), T-Sapphire (S), Venus (V) and mOrange2 (O) results in six populations of double labelled cells, BS, BV, BO, SV, SO, or VO. B Spectra of the fluorescent proteins and the surface markers, showing the fluorophores at the left of the spectrum, separated from the surface markers for expression phenotyping on the right of the spectrum. Spectral diagram from49. C Flow cytometry detection of 6 different labels in a mixed (n ~ 76,000) population derived from a cell culture one passage after FACS purification, eliminating single labelled cells. Axis dimensions set to demonstrate widespread of label detections in each colour group. The right panel shows examples of fluorescent images of double labelled cells. D Quantification of colour group frequencies from flow cytometry data (n = 3) for cell lines G19 and G61. E Experimental workflow encompassing all experimental steps including organoid formation. Experimental steps (“ES”) are indicated as ES 1–ES 6, to provide a generic reference in the text. Naïve cells (G19 and G61) were first analysed for surface marker expression (ES 1), and then transduced with lentivirus encoding two fluorescent labels and incubated to express them (ES 2), analysed by flow cytometry for clonality and surface marker expression (ES 3), propagated in six parallel cultures, over five passages (P1–P5) (ES 4, ES 5, ES 6), with three flow cytometry and surface marker measurements performed at ES 4, 5, and 6. Finally, two of the clonal cultures were processed to generate organoids (ES 7). In addition, mixed organoids were generated directly from mixed dual-labelled cells containing all label combinations before clonal segregation (left part of diagram). Scale bar in A corresponds to 10 µm.

