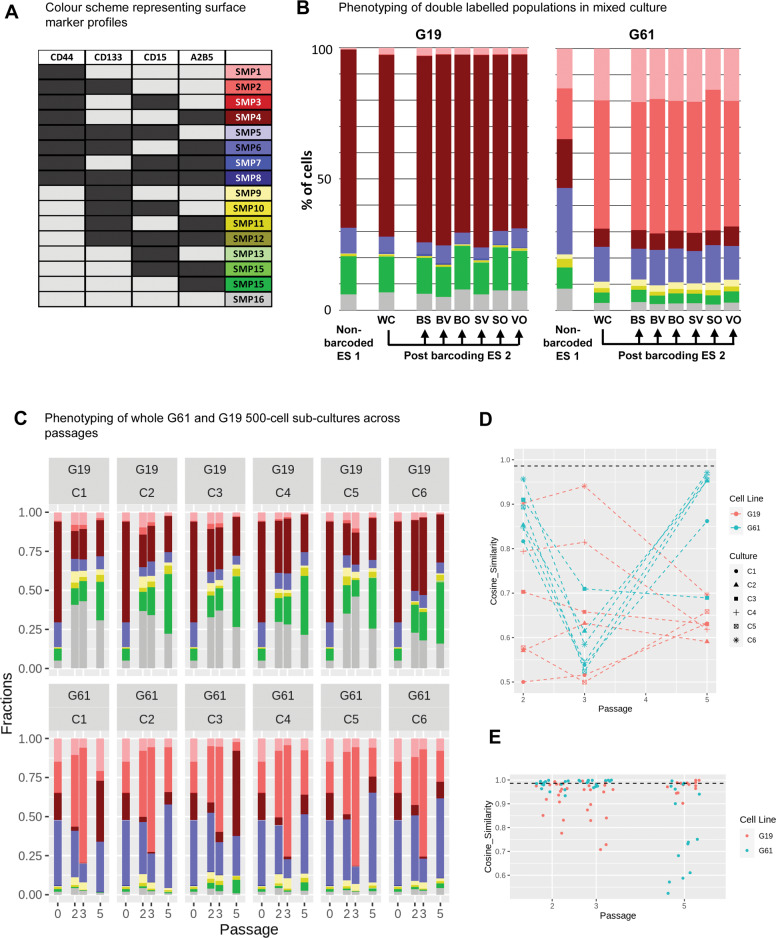
Fig. 3. Surface marker expression on whole cultures and barcoded subpopulations.
A Colour scheme to identify combinations of surface marker expression of CD44, CD133, CD15, and A2B5, similar to ref. 24. B Surface marker expression (“phenotyping”) of non-barcoded G19 or G61 glioma cells (ES 1), compared to the pool of bar-coded cells (post barcoding, WC [whole culture]; ES 2) and separate phenotypic analysis of the individual bar-coded cells (post-barcoding, clones BS, BV, BO, SV, SO, VO). The phenotype of G19 cells prior and post barcoding undergoes less changes than that of G61 where a shift towards CD44+, CD133+ dominance is observed. C Phenotyping of subcultures C1–C6 of cell lines C19 and C61. Each graph shows at the left the column for P0 (post-barcoding, ES 2), and subsequent passages P2, P3, P5 with phenotypes for the whole population in each culture (C1-C6). D Plot of cosine of similarities of cell lines G19 and G61 at different passages compared to P0 (ES 2). Cell line G19 starts with a low degree of similarity between cultures C1-C6, with a range of very similar to very dissimilar cultures (compared to P0; Y axis, cosine of similarity) whilst the degree of similarity is more consistent in culture G61, starting with a higher degree of similarity between cultures compared to P0, which reduces at P3 and gains at P5, i.e. G61 vary over passages but the cultures C1–C6 are coherent with each other. The loss of coherence with P0 at P3 recovers by P5. E Assessment across cultures C1–C6 per passage and culture (C19, C61). Each point is a comparison of two cultures. G19 and G61 exhibit different profiles, with G61 showing coherence within P2 and P3, with a loss of coherence at P5 and G19 showing lack of coherence within P2 and P3, but regain at P5. Black dashed line in D and E—below line p < 0.001 (based on Monte Carlo simulations).

