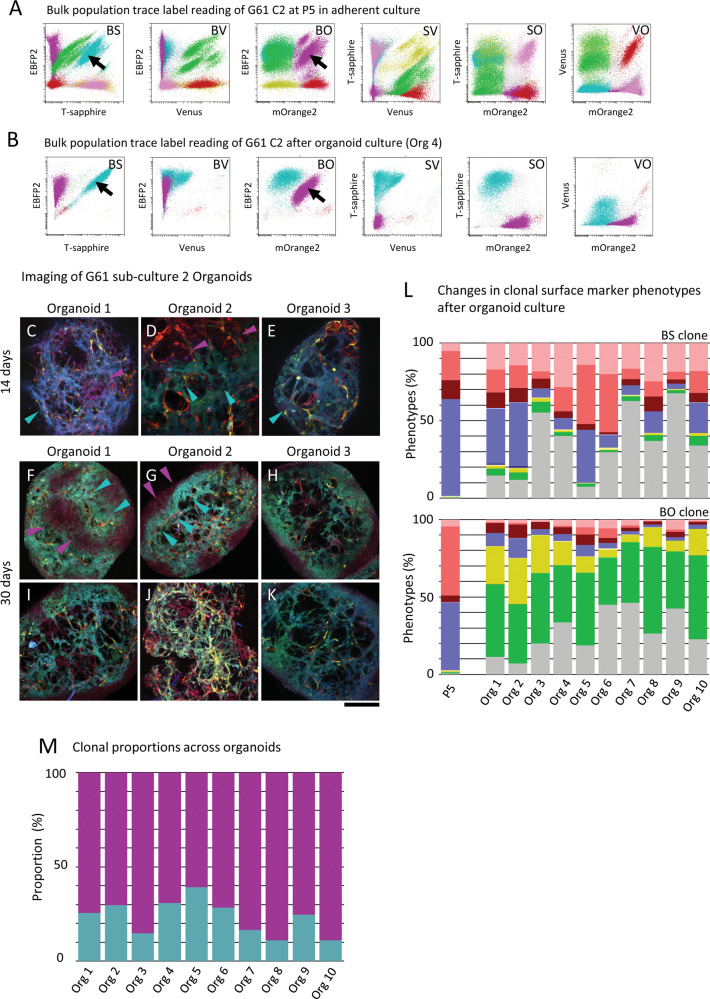
Fig. 5. Maintenance of clonal predominance and plasticity of surface marker expression in tumour organoids.
A P5 culture with a predominance of clonal populations with barcode label BS and BO (cell line G61) to generate organoids. B Flow cytometry of dissociated organoids show the two dominant label populations BS and BO. Arrowheads indicate clonal populations which continue their dominance in organoids. C–E Three separate organoids grown from cells with colour barcodes BS and BO, 14 days after seeding, showing both populations of barcoded cells populating the organoid in specially organised patterns. Arrowheads in C–E point to populations of barcoded clones. Three separate organoids (surface aspect) (F–H), and the same organoids centrally cross-sectioned (I–K) showing spatially organised BS and BO clones as indicated by arrowheads in F and G. L These label populations were then analysed for surface marker expression showing A2B5-dominant populations overall, whilst separate analysis of label barcoded clones shows surface marker separation when analysing clones BS and PO separately, with a marked difference of A2B5 expression, and a notable dominance of cells negative for all surface marker in the BS clone. Colour codes see Fig. 3 and Supplementary Table 3. M Proportion of barcoded clonal populations across ten separately analysed organoids. Scale bar in C–K corresponds to 500 µm.

