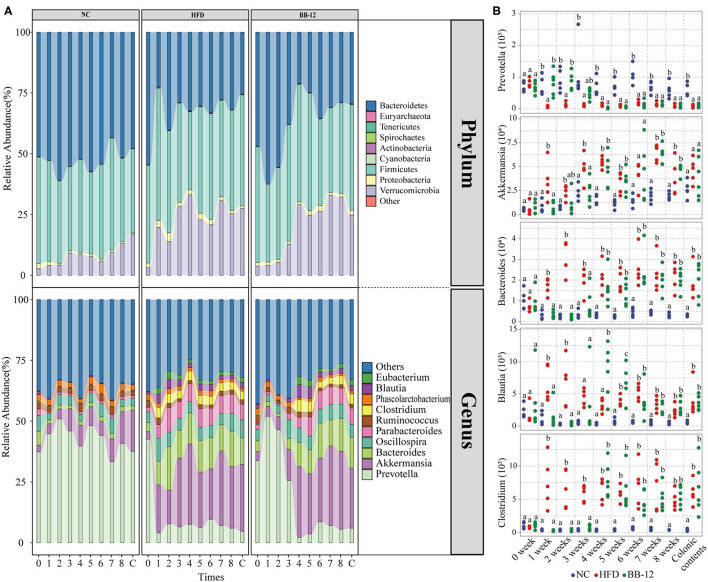
Figure 2.
Gut microbiota taxonomic profiles. (A) Relative abundances of microbial composition at the phylum level and relative abundances of top 10 genera; 0–8 represents 0–8 weeks and C represents colonic content samples. (B) Absolute abundances of microbial taxa (genera level) compared between the NC, HFD, and BB-12 groups. Different letters (a or b) above the box indicate significant difference (p < 0.05) or (p < 0.01).

