Fig. 1.
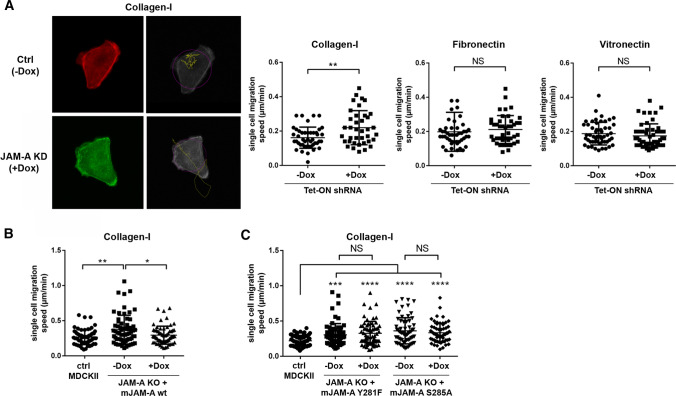
JAM-A limits single cell migration. A Single cell migration of MDCKII cells with inducible expression of JAM-A shRNAs (pEmU6proT, −Dox: shRNA not induced, +Dox: shRNA induced). Control cells (−Dox) were stably transfected with LA-mCherry, JAM-A KD cells (+Dox) were stably transfected with LA-EGFP. Cells were cultured on collagen-I (Col-I), fibronectin (FN), or vitronectin (VN) as indicated. Left panels: representative images of a LA-mCherry-transfected control cell (Ctrl, −Dox) and a LA-GFP-transfected JAM-A knockdown cell (JAM-A KD, +Dox) grown on collagen-I. Black-and-white images show the motility paths (yellow lines); the blob diameters used to track the cell during migration are highlighted by purple circles. Quantifications of single cell migration speed are shown in the right panels. Number of cells analyzed: Col-I: −Dox: 45, +Dox: 38, FN: −Dox: 48, +Dox: 44; VN: −Dox: 52, +Dox: 52, five independent experiments. B Quantifications of single cell migration speed of JAM-A KO MDCKII cells reconstituted with an inducible expression vector for murine JAM-A (pInducer21, −Dox: not induced, +Dox: induced). As control cells, MDCKII cells with inducible JAM-A shRNA expression in the absence of Dox were used. Number of cells analyzed: Ctrl MDCKII: 63; JAM-A KO, −Dox: 64; JAM-A KO, +Dox: 63; three independent experiments. C Quantifications of single cell migration speed of JAM-A KO MDCKII cells reconstituted with an inducible expression vector encoding phospho-deficient mJAM-A mutants (mJAM-A Y281F or mJAM-A S285A in pInducer21, −Dox: not induced, +Dox: induced). Number of cells analyzed: Ctrl MDCKII: 70; JAM-A KO + mJAM-A Y281F: −Dox: 67; +Dox: 65; JAM-A KO + mJAM-A S285A: −Dox: 62; +Dox: 65; four independent experiments). All statistical analyses shown in this figure were performed using Mann–Whitney U test. Data are presented as mean values ± SD. NS not significant; *P < 0.05, **P < 0.01, ***P < 0.001, ****P < 0.0001

