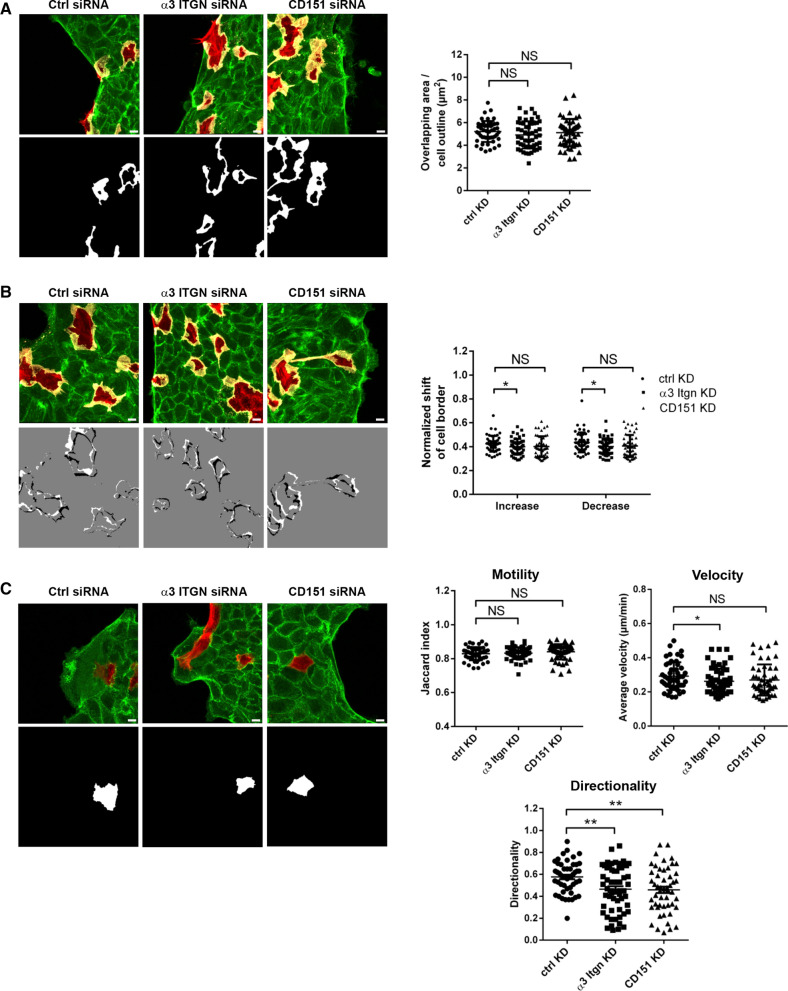
Fig. 6.
Regulation of cryptic lamellipodia dynamics and cell motility in cellular collectives by α3β1 integrin and Tspan CD151. A Formation of cryptic lamellipodia in α3 integrin- and CD151-depleted MDCKII cells. Note that the formation of cryptic lamellipodia is not altered after depletion of α3β1 integrin or of CD151. Scale bars: 10 µm. B Dynamics of cryptic lamellipodia during collective cell migration. Top panels: representative immunofluorescence signals of overlapping areas. Bottom panels: representative binary images illustrating increases (white areas) and decreases (black areas) of cellular overlaps over the observation period (10 h). Right panel: quantification of changes in overlapping regions. Changes were calculated using an ImageJ Macro on the basis of the merged LA-EGFP and LA-mCherry signals (see “Materials and Methods” for details). Data indicate the mean increase or decrease of overlapping regions during the observation period. Number of videos analyzed: n = 50, 10 independent experiments. Scale bars: 10 µm. C Migration behavior of single cells embedded in a cell collective. Left panels: representative immunofluorescence signals of LA-mCherry-positive cells embedded in a LA-EGFP-positive collective (top), and binary images of immunofluorescence images to highlight single LA-mCherry-positive cells. Right panels: quantification of motility, migration velocity and migration directionality of single cells within the collective. Note that high Jaccard index values reflect low motility (see “Materials and Methods” for details). Number of cells analyzed: n = 48 for ctrl MDCKII cells, n = 58 for α3 integrin KD MDCKII cells, n = 50 for CD151 KD MDCKII cells, 10 independent experiments. Scale bars: 10 µm. Statistical analysis of migration velocities was performed using Mann–Whitney U test; all other statistical analysis were performed using two-tailed Student’s t test. Data are presented as mean values ± SD. NS, not significant; *P < 0.05, **P < 0.01

