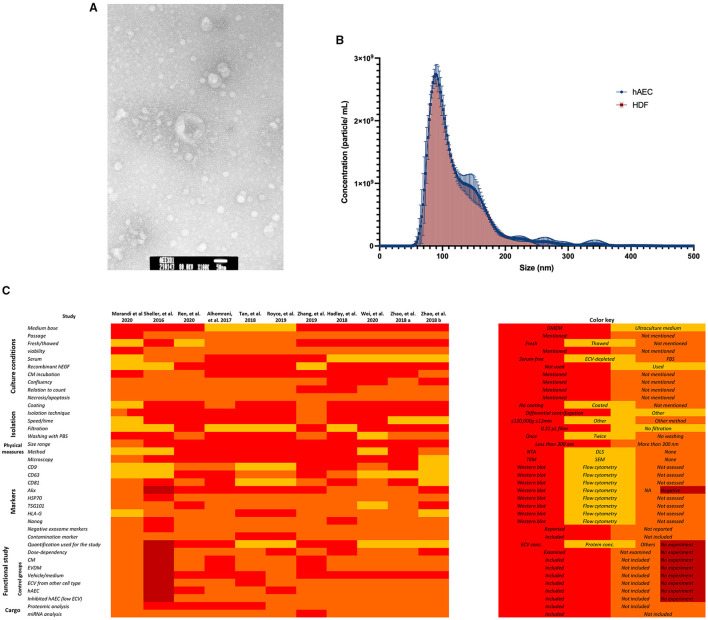
Figure 2.
Example of amnion epithelial cell–derived ECV characterization. (A) Representative transmission electron microscopy image. hAEC-ECVs reveal cup-shaped morphology. Scale bar: 50 nm. (B) Size distribution of human amniotic epithelial cell-extracellular vesicles (hAEC-ECVs) obtained by Nanoparticle tracking analysis. The number of particles of hAEC-derived and human dermal fibroblast (HDF)-derived exosomes were plotted as mean ± SD (circle, blue) and mean ± SD with droplines (square, red), respectively. (C) Variation in methodologies of hAEC-ECV isolation and characterization.

