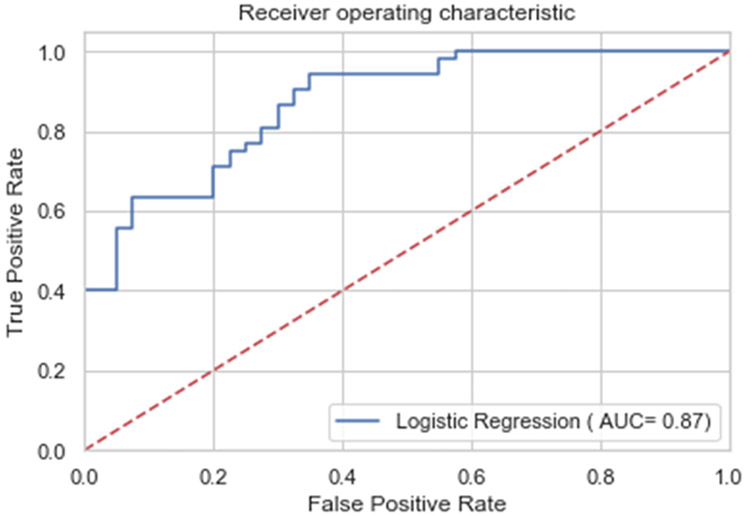
Figure 1.

Area Under Curve (AUC) of a representative fold of Logistical Regression cross-validation. The axis titles are a legacy for AUC diagrams. In terms used in this paper, the vertical axis is sensitivity and the horizontal axis is (1-specificity). A perfect predictor would have AUC of 1.00 and a null predictor would have 0.5. For a summary of AUCs for all cross validation folds of Logistic Regression and of the two Linear Mixed Model ERM models, see Table 2 and Supplementary Table ST3.
