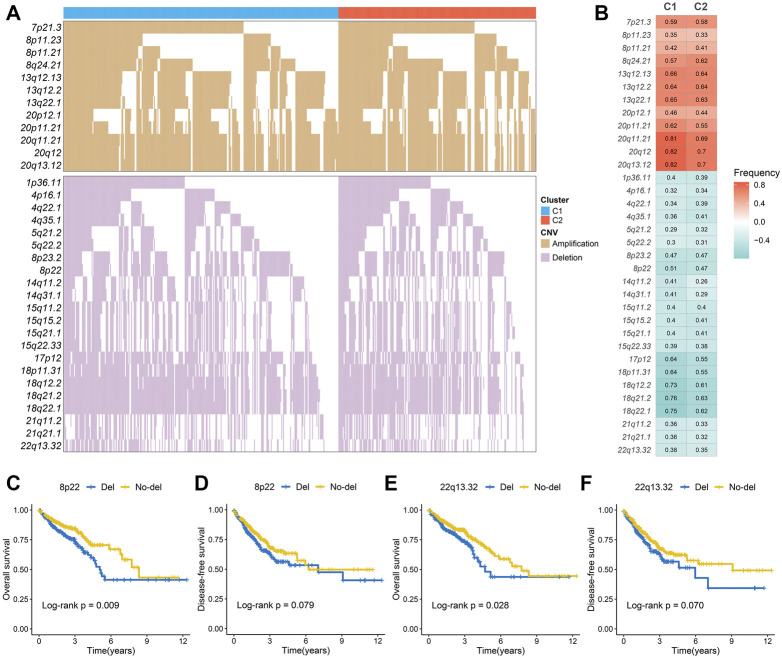
FIGURE 4.
The copy number variations of two immune subtypes. (A,B) The waterfall plot (A) and alteration frequency (B) of significantly amplified and loss chromosomal segments in C1 and C2. (C,D). Kaplan-Meier survival analysis of overall survival (C) and disease-free survival (D) according to the 8p22 deletion. (E,F) Kaplan-Meier survival analysis of overall survival (E) and disease-free survival (F) according to the 22q13.32 deletion.

