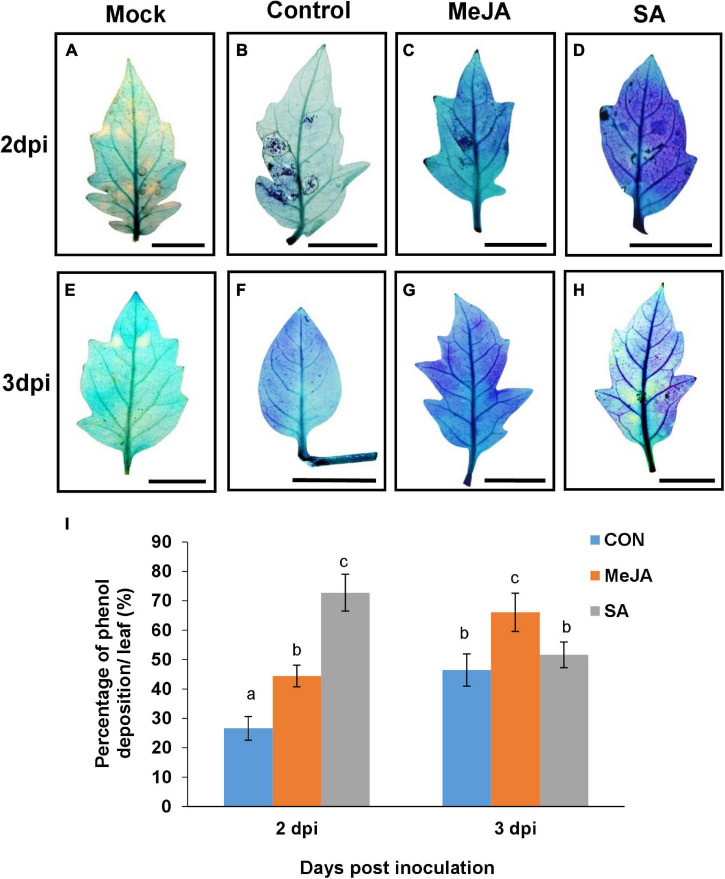
FIGURE 11.
Accumulation of phenol detected by toluidine blue shows that SA priming resulted in more deposition in earlier phase of infection while MeJA priming in the later phases. (A–H) The development of blue color indicate the amount of phenol in leaves of different sets of control and primed leaves at 2 and 3 days post infection. (I) Graph representing the comparison of the above result. Bars represent mean ± S.E.M of six independent experiments. Different letters indicate significant differences among treatments at p < 0.05, according to Duncan’s multiple range test. Bar = 30 mm.

