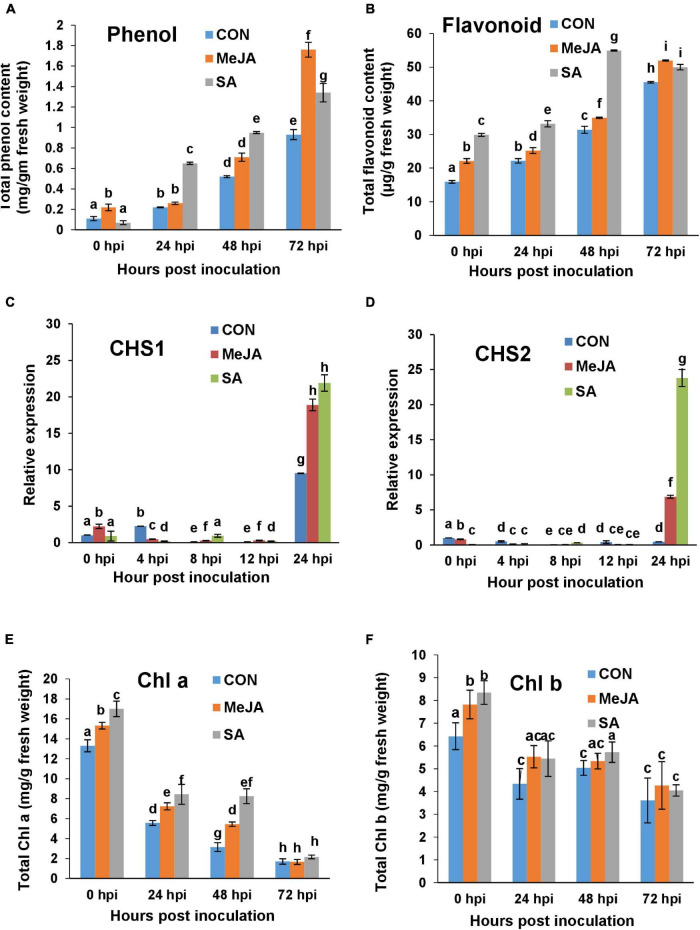
FIGURE 12.
Comparison of accumulation of polyphenolics, induction of their genes, and chlorophyll content in the control and phytohormone primed plants during R. solani pathogenesis. (A) Total phenol content in different sets over a time course. (B) Total flavonoid content. (C,D) Quantitative real-time PCR analysis of the expression of Chalcone synthase genes CHS1 and CHS2 respectively over a time course. (E,F) Chlorophyll a (Chl a) and Chlorophyll b (Chl b) content respectively showing least degradation after infection in SA-primed leaves compared to Control and JA-primed leaves. Bars represent mean ± SEM of three independent experiments with at least three individual plants. Different letters indicate significant differences among treatments at p < 0.05, according to Duncan’s multiple range test.

